Five git commands that tell you where a codebase hurts before you open a single file. Churn hotspots, bus factor, bug clusters, and crisis patterns.
Ally Piechowski · · 4 min read
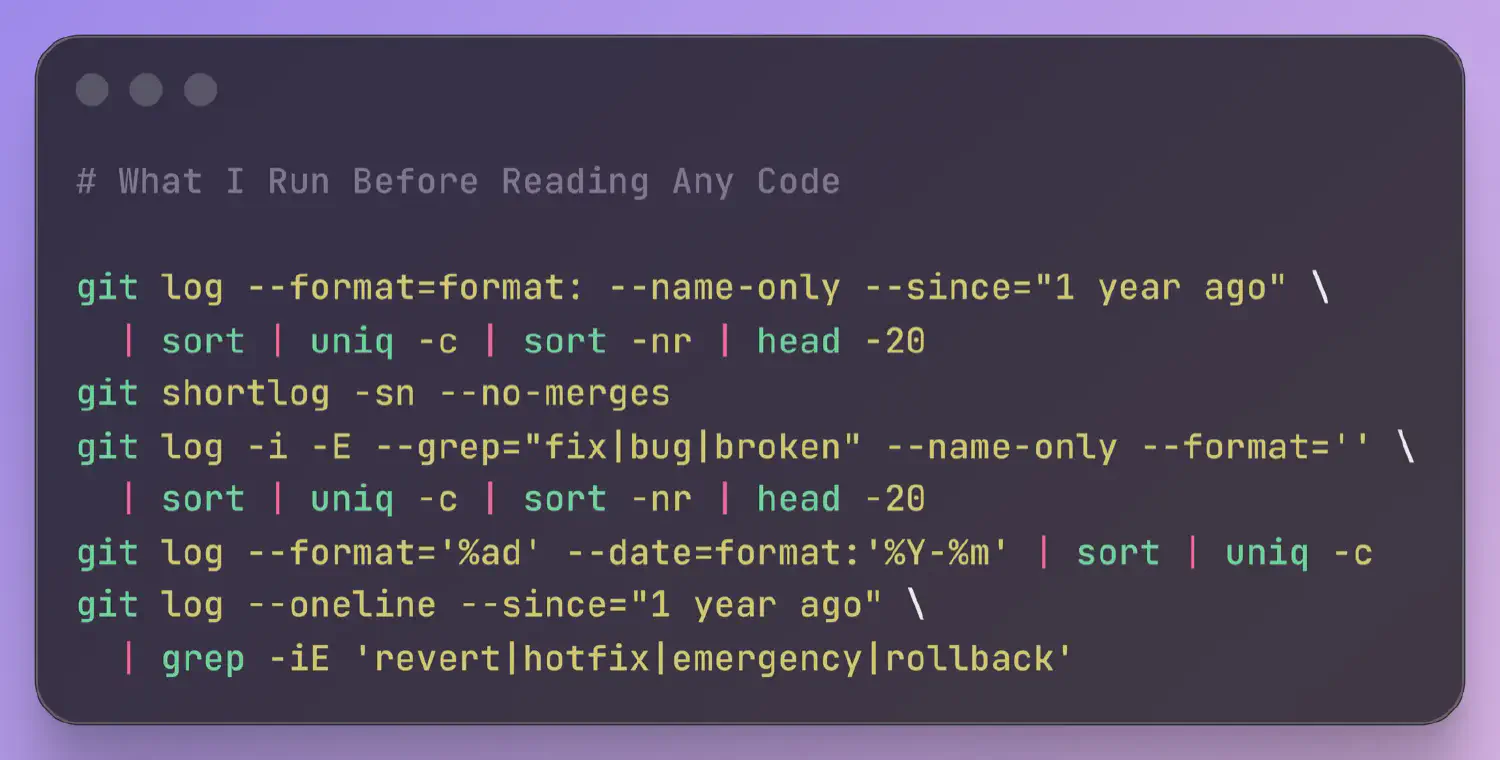
The first thing I usually do when I pick up a new codebase isn’t opening the code. It’s opening a terminal and running a handful of git commands. Before I look at a single file, the commit history gives me a diagnostic picture of the project: who built it, where the problems cluster, whether the team is shipping with confidence or tiptoeing around land mines.
What Changes the Most
git log --format=format: --name-only --since="1 year ago" | sort | uniq -c | sort -nr | head -20
The 20 most-changed files in the last year. The file at the top is almost always the one people warn me about. “Oh yeah, that file. Everyone’s afraid to touch it.”
High churn on a file doesn’t mean it’s bad. Sometimes it’s just active development. But high churn on a file that nobody wants to own is the clearest signal of codebase drag I know. That’s the file where every change is a patch on a patch. The blast radius of a small edit is unpredictable. The team pads their estimates because they know it’s going to fight back.
A 2005 Microsoft Research study found churn-based metrics predicted defects more reliably than complexity metrics alone. I take the top 5 files from this list and cross-reference them against the bug hotspot command below. A file that’s high-churn and high-bug is your single biggest risk.
Who Built This
git shortlog -sn --no-merges
Every contributor ranked by commit count. If one person accounts for 60% or more, that’s your bus factor. If they left six months ago, it’s a crisis. If the top contributor from the overall shortlog doesn’t appear in a 6-month window (git shortlog -sn --no-merges --since="6 months ago"), I flag that to the client immediately.
I also look at the tail. Thirty contributors but only three active in the last year. The people who built this system aren’t the people maintaining it.
One caveat: squash-merge workflows compress authorship. If the team squashes every PR into a single commit, this output reflects who merged, not who wrote. Worth asking about the merge strategy before drawing conclusions.
Where Do Bugs Cluster
git log -i -E --grep="fix|bug|broken" --name-only --format='' | sort | uniq -c | sort -nr | head -20
Same shape as the churn command, filtered to commits with bug-related keywords. Compare this list against the churn hotspots. Files that appear on both are your highest-risk code: they keep breaking and keep getting patched, but never get properly fixed.
This depends on commit message discipline. If the team writes “update stuff” for every commit, you’ll get nothing. But even a rough map of bug density is better than no map.
Is This Project Accelerating or Dying
git log --format='%ad' --date=format:'%Y-%m' | sort | uniq -c
Commit count by month, for the entire history of the repo. I scan the output looking for shapes. A steady rhythm is healthy. But what does it look like when the count drops by half in a single month? Usually someone left. A declining curve over 6 to 12 months tells you the team is losing momentum. Periodic spikes followed by quiet months means the team batches work into releases instead of shipping continuously.
I once showed a CTO their commit velocity chart and they said “that’s when we lost our second senior engineer.” They hadn’t connected the timeline before. This is team data, not code data.
How Often Is the Team Firefighting
git log --oneline --since="1 year ago" | grep -iE 'revert|hotfix|emergency|rollback'
Revert and hotfix frequency. A handful over a year is normal. Reverts every couple of weeks means the team doesn’t trust its deploy process. They’re evidence of a deeper issue: unreliable tests, missing staging, or a deploy pipeline that makes rollbacks harder than they should be. Zero results is also a signal; either the team is stable, or nobody writes descriptive commit messages.
Crisis patterns are easy to read. Either they’re there or they’re not.
These five commands take a couple minutes to run. They won’t tell you everything. But you’ll know which code to read first, and what to look for when you get there. That’s the difference between spending your first day reading the codebase methodically and spending it wandering.
This is the first hour of what I do in a codebase audit. Here’s what the rest of the week looks like.