Yeats wrote of an aged man as “a tattered coat upon a stick.” But for most of us, aging comes as small diminishments: the morning that takes a little longer to shake off, the flight of stairs you notice, the cold that lingers a week instead of three days, the run that used to feel easy. We register these shifts as fatigue or a busy season before we register them as time. The body is keeping score long before we are.
Each of these feelings has a number behind it.
- The morning that takes longer to shake off lines up with kidney and liver filtration slowing down. Two glasses of wine hit differently at forty than at twenty, and as eGFR drops a few points per decade, the cleanup takes longer.
- The flight of stairs you notice shows up as red blood cells slowly enlarging, each one a little less efficient at carrying oxygen.
- The cold that lingers a week instead of three days is your lymphocyte counts thinning, the frontline cells that recognize and clear viruses.
- The run that used to feel easy tracks with hemoglobin A1c creeping upward, insulin sensitivity stiffening and muscles slower to pull glucose from the blood.
None of these metrics move more than a few percent in a year, but stacked across decades, they describe an aging body.
Which biomarkers rise and fall fastest with age? Which of these can be stopped, slowed, or reversed? In this post we’ll go through them.
 The biomarkers that rise and fall the most with age.
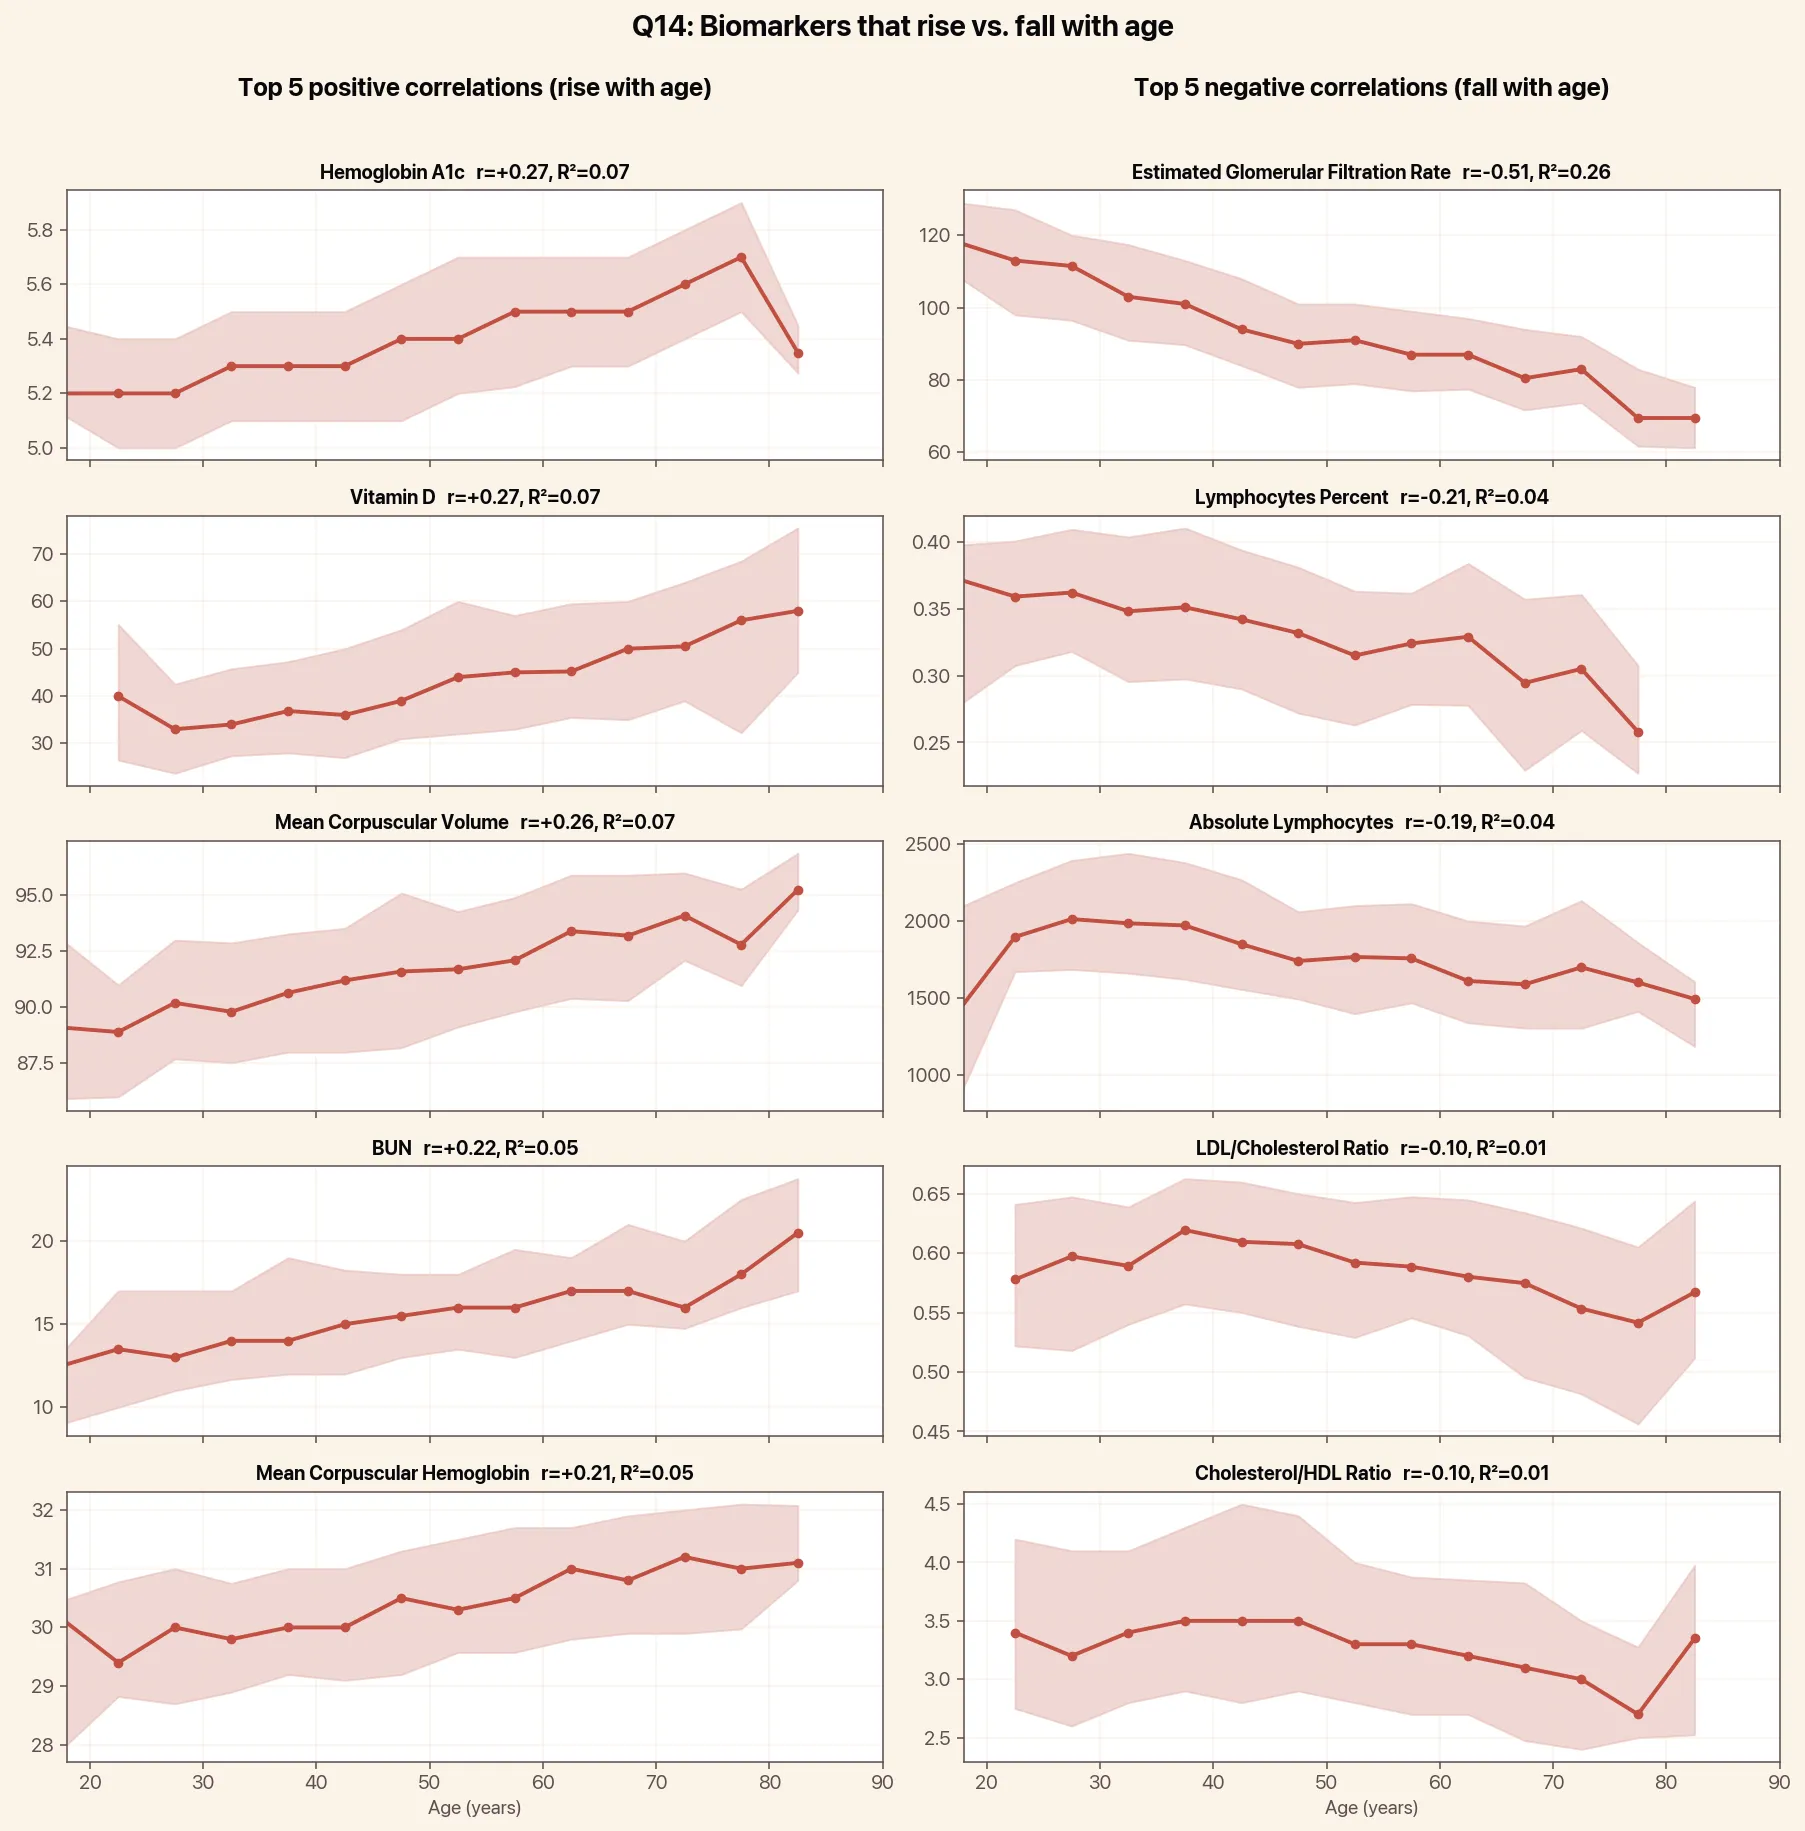
eGFR is the standard measure of how fast your kidneys clear waste from the blood, and it’s the runaway leader on this list. In our data it falls roughly 6 to 7 points per decade after age 20, from a typical 110 mL/min/1.73m² in the twenties to around 75 by the eighties. Its correlation with age (r = -0.51) is nearly twice as strong as the next-best signal on the panel. The drop matches the consensus from the Baltimore Longitudinal Study of Aging, which has tracked the same loss for decades.
The interesting part isn’t the average slope, though. It’s the spread. The Baltimore cohort found that roughly a third of healthy older adults had essentially no measurable decline in kidney function over decades of follow-up. We see the same pattern in our data: a real subset of people in their seventies hold eGFR values that would be normal in a thirty-year-old. What separates them from the steep decliners is unromantic and familiar. Blood pressure under good control. Fasting glucose and A1c in the healthy range. No protein leaking into the urine. Avoidance of chronic NSAID use. These are the factors that show up over and over in the longitudinal data on “preserved” kidney aging.
One small technical note: the eGFR formula uses age as an input, which slightly exaggerates the apparent age effect. Cystatin C is an alternative that doesn’t bake age into the equation. It shows a gentler but still pronounced decline, so the kidney aging signal is real even when you back out the math.
HbA1c measures average blood sugar over the past three months. In our data it ticks up about 0.1 percent per decade. That sounds tiny, but it adds up. A 25-year-old with an A1c of 5.0 will, on average, sit closer to 5.5 by 70 even if they never develop diabetes.
Part of this is real glucose intolerance. Insulin sensitivity drops with age, beta cells respond more slowly, and visceral fat tends to accumulate. Part of it is mechanical. Red blood cells live longer in older adults, giving glucose more time to glycate the hemoglobin inside them.
The rise is not inevitable, though, and this is one area where the gap between trajectories is wide. Endurance athletes, people who keep their waist circumference stable through middle age, and people who do regular resistance training largely flatten the slope. Continuous glucose monitor studies suggest that postprandial spikes (not fasting glucose) are the earliest sign of age-related glucose intolerance, and they respond quickly to changes in meal composition and walking after meals.
Two of the top five risers, mean corpuscular volume (MCV) and mean corpuscular hemoglobin (MCH), are about the size of red blood cells. MCV climbs about 1 femtoliter per decade. Most people will move from the low 80s in their twenties into the low 90s by their seventies, all within the normal range.
This is one where the underlying driver matters more than the average. The most common reasons MCV creeps up are subclinical B12 or folate insufficiency (both important for DNA synthesis in maturing red cells), modest hypothyroidism, and regular alcohol intake. MCV is one of the most sensitive markers of long-term alcohol use, more sensitive than the liver enzymes most people watch. People who keep B12 and folate replete, who treat low thyroid early, and who don’t drink heavily tend to hold MCV steady deep into life. A rising MCV in someone who feels fine is worth pairing with a B12, folate, and TSH check.
Two of the top five fallers are the same thing measured two ways: lymphocyte percent and absolute lymphocyte count. Both drop steadily with age, by roughly 100 cells per microliter per decade. This is the blood-panel signature of immunosenescence. The thymus involutes, naive T-cell output slows, and the lymphocyte pool gradually shifts toward memory cells.
The clinical consequence is real. Lower lymphocyte counts in older adults predict worse responses to vaccines, slower recovery from viral infections, and higher mortality in the year after a hospital stay. The encouraging news is that this is one of the few aging markers that exercise visibly modifies. A long-running study of master cyclists in their seventies and eighties found that lifelong endurance training preserved naive T-cell output and thymic mass at levels close to people in their twenties. Regular aerobic and resistance training, even started in midlife, slow the lymphocyte drift more than any pharmacological intervention currently has evidence for.
The last two in the bottom-five fallers are ratios: LDL/total cholesterol and total cholesterol/HDL. Both drift modestly down with age. The reason isn’t that LDL is dropping. Absolute LDL is essentially flat across adult life in our data. It’s that HDL rises slightly and triglyceride-rich particles shift the composition of total cholesterol, so the fraction that’s LDL falls. This is a useful reminder that single ratios can move for reasons that don’t match the intuitive story. If you’re tracking cardiovascular risk through middle age, the absolute LDL number (or better, ApoB) is the figure that matters. The ratio drifting downward is not, on its own, evidence that things are improving.
Vitamin D shows up in the top five risers, which surprised us until we looked at who’s contributing the data. Empirical members in their fifties and sixties are far more likely to be supplementing vitamin D than members in their twenties. The age slope here is behavioral. Population studies of vitamin D status that don’t filter for supplementation generally show levels falling, not rising, with age.
If you’re going to watch a small set of numbers across decades, kidney function (eGFR or cystatin C), Hemoglobin A1c, lymphocyte counts, and MCV will tell you more about your biological age than the lipid panel that gets all the attention. The lipid panel matters for cardiovascular risk in any given year. These four are what change as you age.
The more important point is that the average slope is not your slope. For each of these markers, a real subset of people stay close to their younger selves into their seventies and beyond, and the levers that separate the two groups are mostly knowable in your thirties and forties: blood pressure, blood sugar, body composition, alcohol, sleep, and consistent aerobic and resistance training. The earlier you have a personal baseline, the earlier you can tell which trajectory you’re on.
See your full Empirical panel.
Get your free 30-day heart health guide
Evidence-based steps to optimize your heart health.