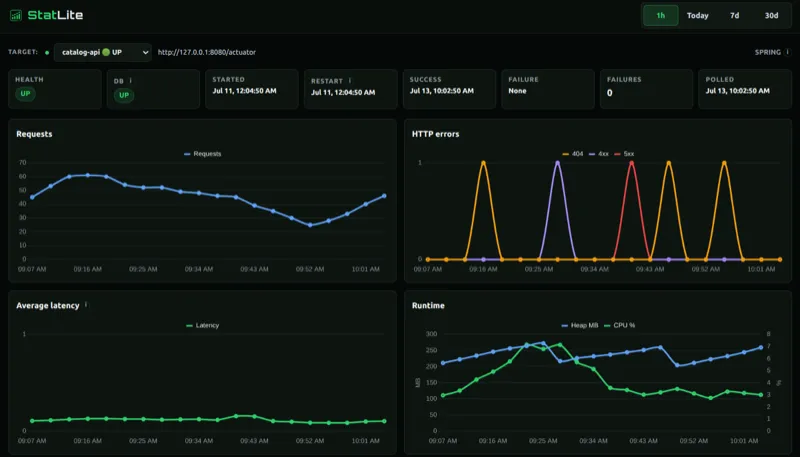
Running one Spring Boot application or a handful of them on a VPS still calls for basic operational visibility. You need to know whether an application is reachable, whether errors are rising, and whether it restarted. You may not need a complete monitoring platform to answer those questions.
Spring Boot Actuator already exposes much of that information. StatLite turns it into a focused dashboard for health, requests, errors, latency, memory, uptime, and restarts. It runs as one Go binary and stores its history in SQLite.

Monitor Spring Boot without operating a full monitoring stack.
Why the usual options can be more than you need
Actuator gives Spring Boot applications useful health and Micrometer metrics endpoints. They are excellent for integration, but repeatedly opening JSON endpoints is not a convenient everyday dashboard.
Spring Boot Admin adds broader application-administration features. Prometheus and Grafana are strong choices when you need a larger monitoring system, flexible queries, or shared dashboards across an estate.
For a few services on one VPS, a narrower dashboard can be enough. StatLite reads the Actuator data you already have and shows the operational signals most useful during routine checks.
The questions a small deployment needs answered
- Is the application reachable and healthy?
- Are errors increasing?
- Are requests slowing down?
- Is memory usage growing?
- Did the application restart?
- Are related services, such as a database, reachable?
Quick comparison
| Tool | Operational complexity | Best fit |
|---|---|---|
| Raw Actuator endpoints | Low | Occasional manual checks |
| Spring Boot Admin | Medium | Application administration and monitoring |
| Prometheus and Grafana | High | Larger deployments and advanced observability |
| StatLite | Very low | A few Spring Boot services on a small server |
These tools can also coexist. Choosing StatLite for a focused dashboard today does not prevent adopting Prometheus and Grafana later if your requirements grow.
Set up StatLite in a few minutes
The following example uses the runnable Spring Actuator demo included with StatLite.
1. Expose health and metrics from Spring Boot
Add the needed Actuator endpoint exposure to your application configuration. Keep Actuator reachable only from trusted networks and add authentication where your deployment requires it.
management:
  endpoints:
    web:
      exposure:
        include: health,metrics
  endpoint:
    health:
      show-details: always
For the included demo, start the application from examples/spring-actuator-demo:
mvn spring-boot:run2. Install StatLite
Use the installation method for your platform in the StatLite installation guide. It covers the release installer, Homebrew, and what each method does and does not set up for you.
Developers who prefer to build from source can clone the repository and build the binary:
git clone https://github.com/PVRLabs/statlite.git
cd statlite
go build -o statlite ./cmd/statlite
3. Add one target configuration
server:
  listen: "127.0.0.1:9090"

storage:
  sqlite_path: "./statlite.sqlite"

polling:
  interval: "10s"
  timeout: "5s"

targets:
  - name: "spring-demo"
    actuator_base_url: "http://127.0.0.1:8080/actuator"
listen keeps the dashboard local by default. sqlite_path is the file used for dashboard history. actuator_base_url points at the application’s Actuator base URL. For Basic Auth, multiple targets, retention, and production security details, see the configuration documentation.
4. Open the dashboard
./statlite --config ./statlite.yamlOpen http://127.0.0.1:9090 in a browser. StatLite polls on the configured interval, so wait for the next poll after creating traffic or restarting the application.
If you are following the included demo, generate traffic in a second terminal from the StatLite repository root:
./examples/spring-actuator-demo/generate-traffic.shThe script sends successful, database, and slow requests, plus 400, 404, and 500 responses to the demo application so the request and error charts have activity to show. Wait for the next StatLite poll after running it.
See the dashboard updating? If StatLite fits your setup, star the repository to bookmark it and help more Spring Boot developers find it.
Why StatLite stays small
- A single Go binary
- SQLite storage
- No monitoring agent
- No custom application instrumentation beyond Actuator
- Suitable for systemd deployment
- Multiple Spring Boot targets in one configuration
It is intentionally Actuator-first. You enable or expose Actuator as needed; StatLite does not remove that setup step.
When not to use StatLite
Use a broader observability platform when you need many services or hosts, long retention, advanced metric queries, alert routing, distributed tracing, centralized logs, or organization-wide dashboards.
StatLite is not a replacement for enterprise observability. It is a focused option when the operational job is to monitor a few Spring Boot services without operating a full Prometheus and Grafana stack.
Monitor your first Spring Boot application with StatLite.