In Post 8 we built the optimization toolkit that turns a problem into a solvable form, learning how gradients and convexity give us a path to good answers. Now we face the harder truth: some problems resist every clever trick we know, and the only honest response is to understand exactly how hard they are, then reach for methods that trade certainty for speed. By the end of this post we will have solved a 12-airport traveling salesman problem (find the shortest round trip visiting every airport once) exactly at 62,741 km, then watched three different heuristics (approximate methods that trade guaranteed optimality for speed) chase that number with varying success, and we will understand why the gap between them is not a failure but the very nature of hard problems.
The OpenFlights dataset gives us the raw material: about 7,700 airports and 67,000 routes in roughly 2 MB of CSV files. We build a graph from the routes, compute great-circle distances between airports, and construct a small but real traveling salesman problem that spans six continents. The through-line of this post is the gap between what we can prove and what we can compute, and how every method we meet is really a different way of negotiating that gap.
The data
Before any solver touches a tour, we need to know what we are working with. The route graph has 3,425 nodes and 19,256 edges after we drop duplicates and self-loops, and the degree (number of direct connections) distribution shows the pattern immediately.
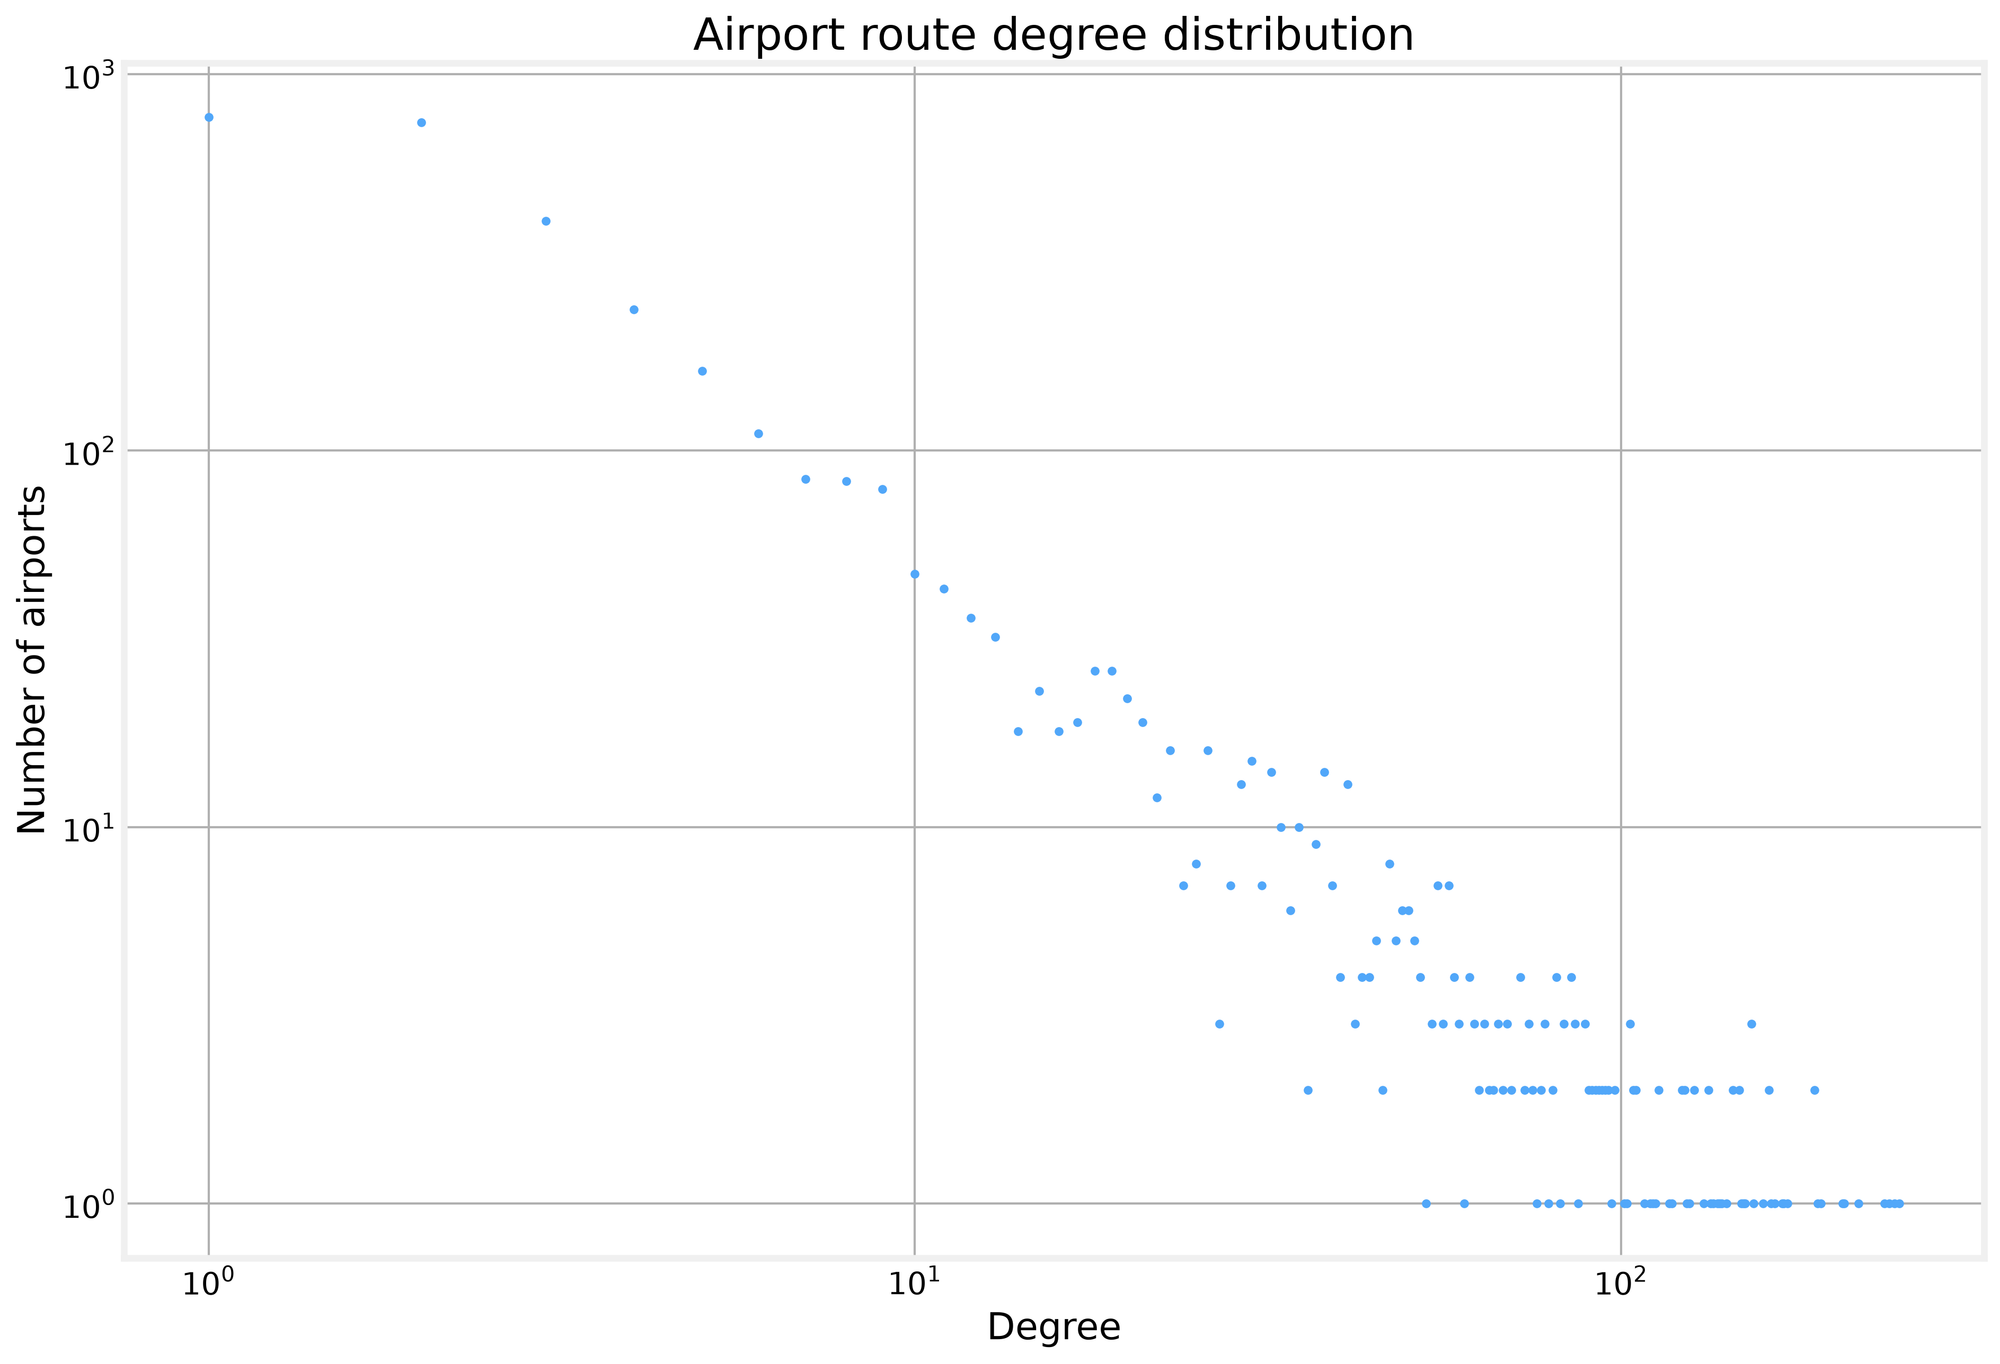
Figure 2. Degree distribution has a heavy tail: a few hubs have enormous degree, while most airports connect to only a handful of destinations.
The log-log plot shows a heavy tail: a few hubs like LHR and JFK carry enormous degree while most airports connect to only a handful of destinations. The hub base rate, defined as airports with degree at least 10, sits at 21.9 percent. This is the structure that makes a geographically spread TSP meaningful, because the giant component holds 3,397 of our 3,425 airports, so a tour across major cities stays within one connected world.
The bar chart confirms the imbalance: hubs are a minority, yet they dominate connectivity.
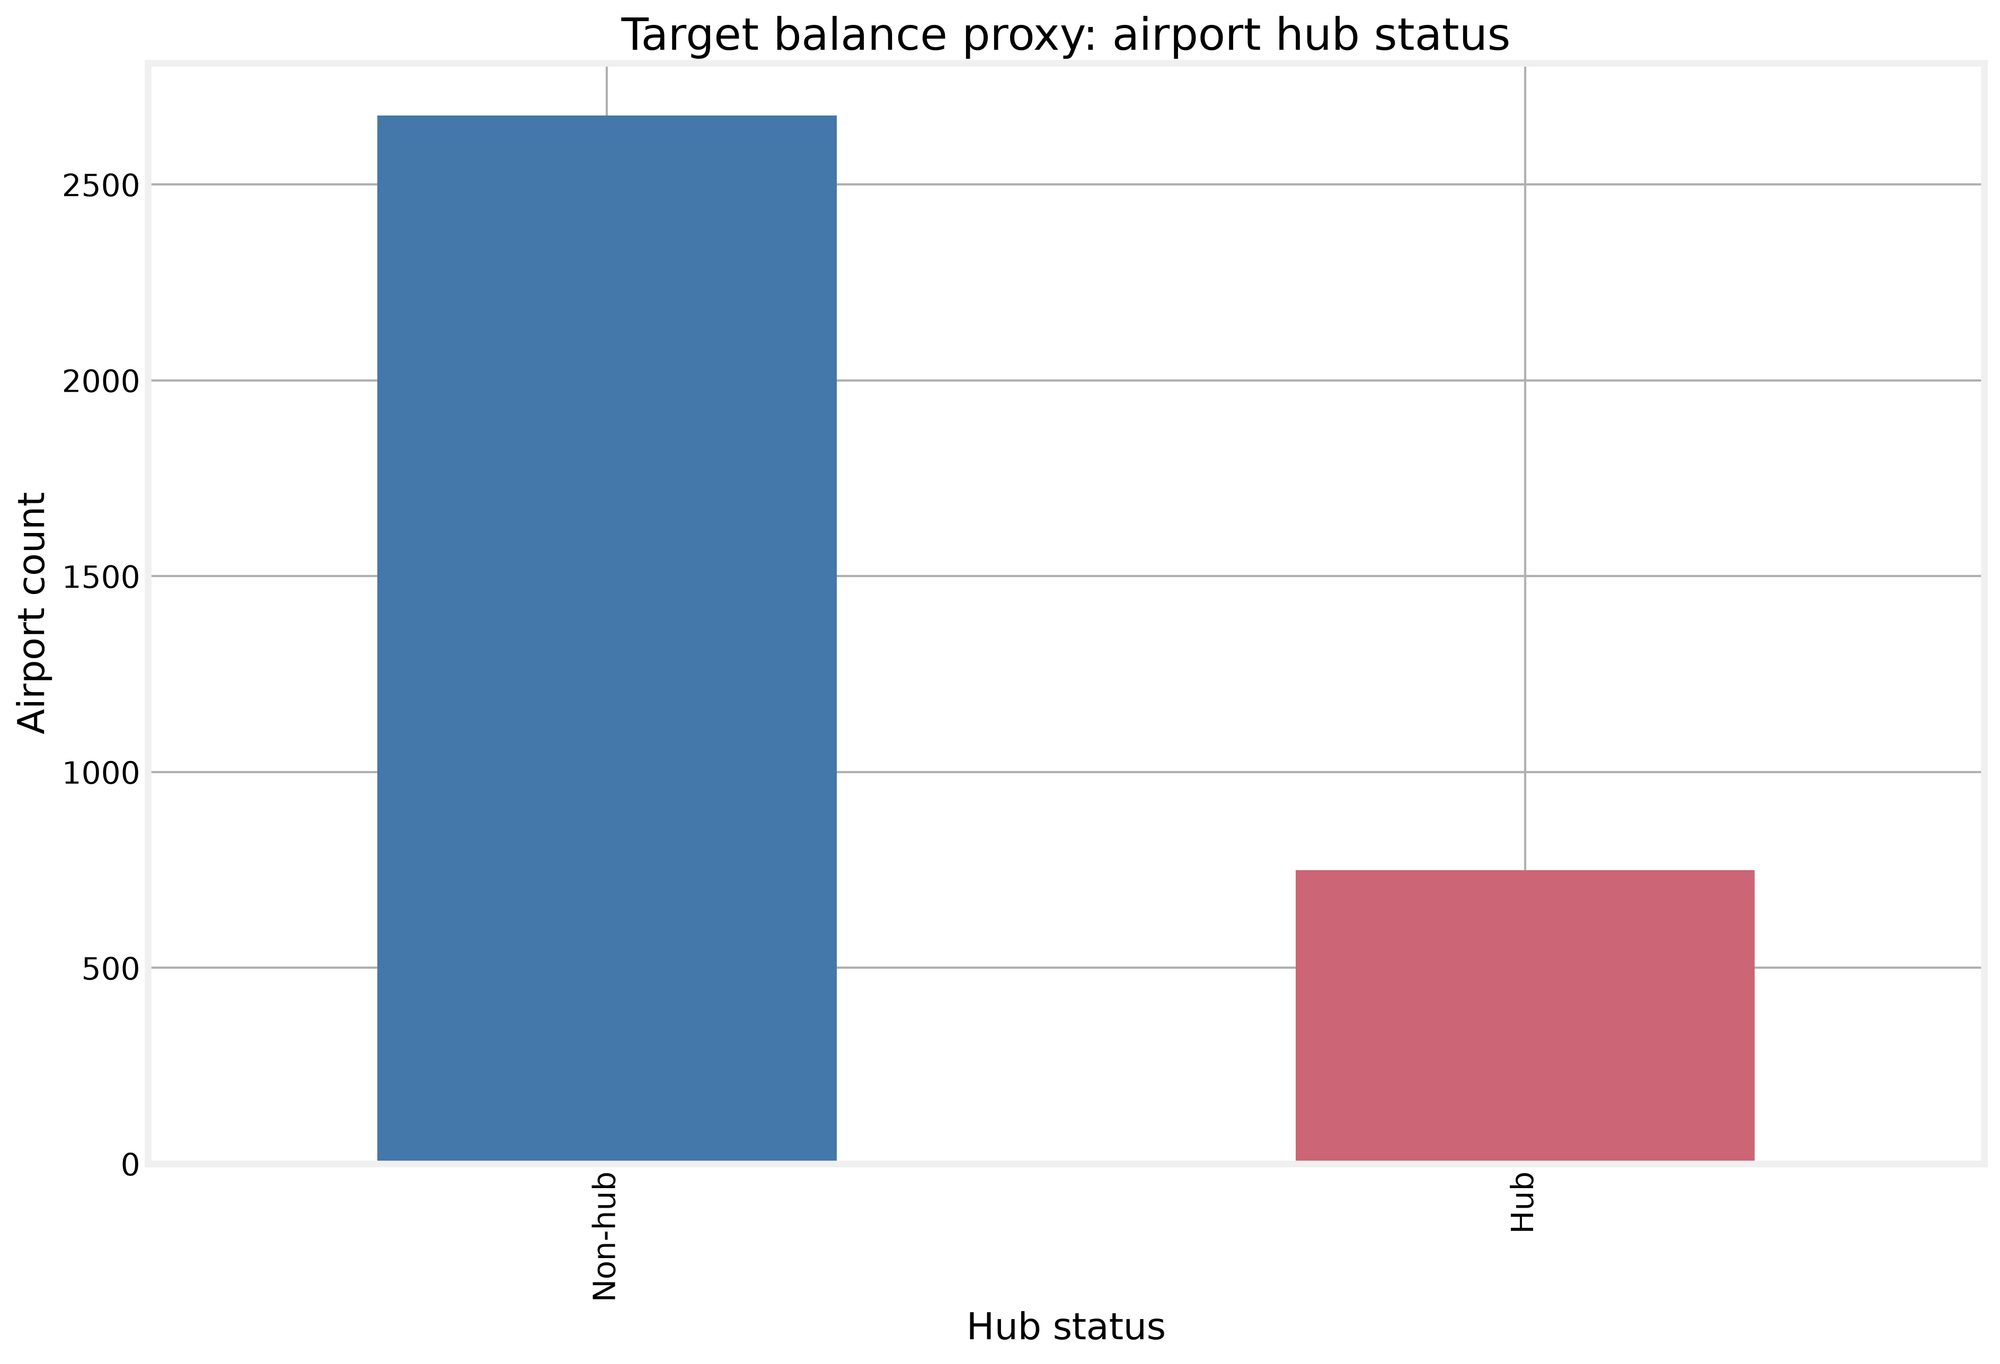
Figure 1. Hubs are a small minority of airports but dominate connectivity.
For our purposes this matters because a 12-airport sample drawn from major international hubs will have realistic distances and a genuine optimization problem. We also found 1,625 duplicate IATA rows and one self-loop, which we collapse before building the tour instance. The data is messy enough to be real, clean enough to work with.
Hardness and randomness
With the graph built, the first module confronts the wall between answers we can check and answers we can find. P vs NP asks whether every problem whose answer we can check quickly also has a solution we can find quickly, and for the problems in this post we accept the consensus answer: no. Polynomial reductions let us convert one hard problem into another, and we demonstrate this with a five-node graph where the minimum vertex cover (a set of nodes that touches every edge) is the set {0, 1, 3} of size 3. The complement of that cover, {2, 4}, is automatically an independent set (a set of nodes with no edges between them), and we verify that no edge connects the two nodes. This is the reduction in miniature: solve one problem, get the other for free.
SAT (Boolean satisfiability: can a formula's clauses all be made true by some assignment) is the canonical NP-complete (the hardest class of NP problems; a fast method for one would fast-solve all of them) problem, and we brute-force a three-variable instance with clauses (1, -2), (2, 3), (-1, -3). The satisfying assignment comes back as {1: True, 2: True, 3: False}, found by checking all eight possible assignments. At three variables this is instant, but the exponential growth is the whole point.
The Traveling Salesman Problem is our running example, and we build a 12-airport instance with a mean pairwise distance of 9,600 km. Monte Carlo algorithms estimate by random sampling, so we draw 2,000 random tours and watch the distribution: the mean lands at 115,019 km, the best random tour at 75,277 km. Random tours almost never respect geography, which is why the mean sits so far above any sensible route. Las Vegas algorithms use randomness but always return a correct answer, and our randomized quicksort on the airport coordinates proves the point: the output is always sorted, only the runtime varies.