I’m writing this so you don’t slap your forehead like I almost did when I decided to run swap in production to absorb memory spikes.
I had a cgroup with two processes: one is a Go process that calls io.ReadAll and then proto.Unmarshal, creating a blob and then a graph struct (which is marked as scan by Go’s allocator). The other process is an HTTP server that mostly stays quiet.
Whenever the collector runs, it reads those scan spans, pointer by pointer, and decides what to do with them. So I thought: ok, under memory pressure, the kernel is going to evict pages to the swap device, but since the eviction is per cgroup, and not per process, both processes’ pages are going to be evicted - so there is only a small chance that this will turn into a sad dance of swap-in and swap-out between the kernel and the garbage collector.
I was wrong. While experimenting with this, I found a problem that could’ve hurt me: Go’s garbage collector reads its metadata (outside the heap, in a region that is not freed) in a stop-the-world pause, and that metadata can be in swap.
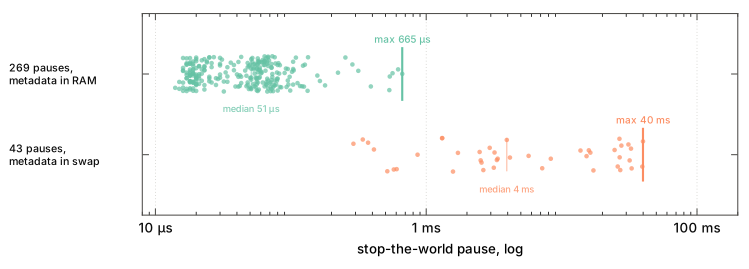
I did a mock run on a Hetzner box using kernel 6.8 with MGLRU enabled1 You can find everything about these experiments: plots, the mock allocator, bpf scripts, python scripts, etc., here: https://github.com/frnsimoes/go-gc-swap-cost. The median pause was around 51 us. With the metadata on the NVMe, the worst pause was 40ms.

To check where those 40ms went, I wrote a small bpf script that counts page faults while the world is stopped. This was the worst one: 39902 us, faults during it 228, 39013 us in faults. 39 of those 40ms were spent in 228 page faults. Those faults happened inside the GC’s bookkeeping:
// addr2line output
0x42e5c8  runtime.(*spanSet).reset         /usr/local/go/src/internal/runtime/atomic/types.go:194
0x4219de  runtime.finishsweep_m            /usr/local/go/src/runtime/mcentral.go:71
0x4629cf  runtime.gcStart.func2            /usr/local/go/src/runtime/mgc.go:724
0x46dd8a  runtime.systemstack              /usr/local/go/src/runtime/asm_amd64.s:518
0x4169dc  runtime.gcStart                  /usr/local/go/src/runtime/mgc.go:722

0x4276a4  runtime.nextMarkBitArenaEpoch    /usr/local/go/src/runtime/mheap.go:2481
0x421a65  runtime.finishsweep_m            /usr/local/go/src/runtime/mgcsweep.go:268
0x4629cf  runtime.gcStart.func2            /usr/local/go/src/runtime/mgc.go:724
0x46dd8a  runtime.systemstack              /usr/local/go/src/runtime/asm_amd64.s:518
0x4169dc  runtime.gcStart                  /usr/local/go/src/runtime/mgc.go:722
That’s a potential failure mode. Go’s GC has to stop the world at two points: when it performs a sweep termination, and when it performs a mark termination. We had 312 of those pauses in 30 minutes.
So here is why this happens: the runtime allocates those pages. They are not freed, but reused. Those pages are read in GC cycles. Because the kernel evicts pages by age, it sends the least recently accessed pages to swap. The GC runs, stops the world, tries to read those pages, but now we have a major page fault. The kernel needs to read PTEs, and then call do_swap_page, find a new frame, charge it to the cgroup, read the pages, submit a bio, wait for the disk, and put them back in memory - just to keep it short.
Those 40ms seem harmless at first. But we are talking about a stop-the-world pause. Those 40ms mean everything has stopped - in Go’s terminology, every P has stopped, so, for example, if a goroutine was waiting for I/O, during that pause the I/O might return and there would be no one to handle it. 40ms is 800 times the median pause. It happens two or three times per memory spike during the test. It is a lot.
And then I noticed another thing: building one 511 KiB message, which usually takes 3-5 ms, jumped to 105 ms on the NVMe and 903 ms on Hetzner’s network volume. Per message, this costs more than the metadata pause. But only the goroutine doing the allocation pays that price, so at least it’s localized, and not global like the metadata one.

I haven’t confirmed where that time goes, but even so I wanted to mention it here, because that’s another cost you would have to pay. In any case, I agree with Chris Down, swap is not evil. But, yeah, it didn’t behave well with garbage collection, and, in production, I’m collecting a lot.
Update, September 14.
Someone asked me if Go 1.26’s Green Tea garbage collector changed the way the GC reads metadata. I measured it, and the impact is negligible.
