
Last night we said Bank of America would use its brand new and "unexpected" $1.2 billion (non tax-deductible) money-laundering penalty as cover for an ugly quarter. This morning it tried to do just that.
Just hours after Treasury fined the bank more than $1.21 billion for willfully failing to report over $5 billion in suspicious transactions (and for having "prioritized its revenues" over compliance), BofA reported Q3 results that missed almost everywhere that matters: FICC missed, equities missed, total revenue missed, and adjusted EPS missed. As we put it last night, it was "perfect timing for tomorrow's Adjusted EPS to miss net of 'one time almost criminal items'" and, sure enough, the bank's own release dutifully explains that "other net loss of $1.4 billion included a non-tax-deductible regulatory settlement charge of $1.2 billion."
The problem for BofA is that the fine accounts for the gap between GAAP and adjusted EPS, and nothing more. GAAP EPS was $0.91; strip out the 17 cents from the penalty and you get adjusted EPS of $1.08, which still missed the $1.10 consensus. In other words, even the "clean" number was a miss.
With that in mind, here is the scorecard for Q3:
- Adjusted EPS $1.08, missing estimate of $1.10; GAAP EPS $0.91
- Revenue net of interest expense $29.96 billion, missing estimate of $30.76 billion
- Trading revenue excluding DVA $5.06 billion, missing estimate of $5.41 billion
- FICC trading revenue excluding DVA $2.55 billion, missing estimate of $2.86 billion
- Equities trading revenue excluding DVA $2.51 billion, missing estimate of $2.63 billion
- Net interest income $16.45 billion, beating estimate of $16.24 billion (NII FTE $16.61 billion)
- Net interest yield 2.16%, beating estimate of 2.11%
- Wealth & investment management total revenue $7.12 billion, beating estimate of $7.06 billion
- Investment banking revenue $1.80 billion, beating estimate of $1.77 billion
- Advisory fees $471 million, missing estimate of $483.3 million
- Debt underwriting revenue $958 million, beating estimate of $920 million
- Equity underwriting revenue $395 million, missing estimate of $422.5 million
- Provision for credit losses $1.27 billion, below estimate of $1.49 billion
- Net charge-offs $1.35 billion, below estimate of $1.44 billion
- Compensation expenses $10.97 billion, estimate $11.08 billion
- Non-interest expenses $19.72 billion; efficiency ratio 65.8%
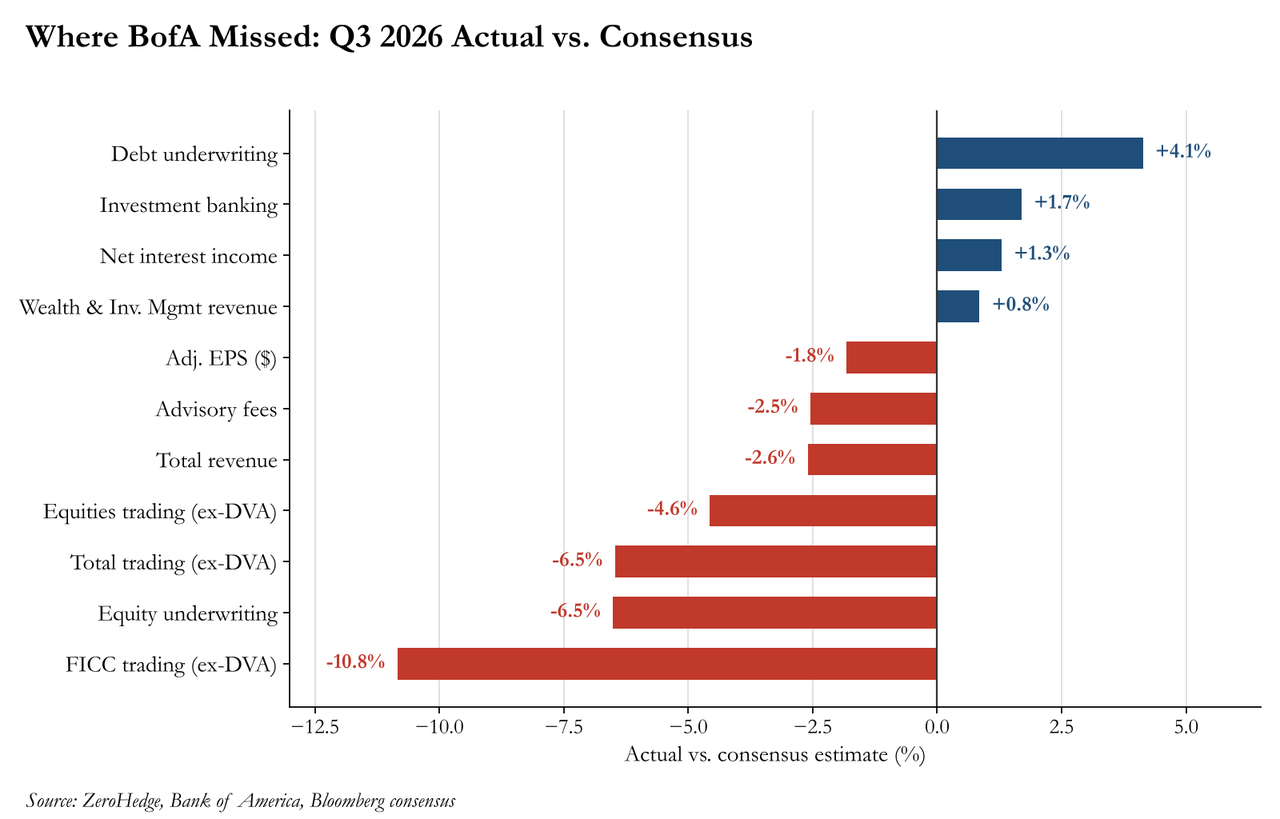
Visually, the misses cluster precisely where the bank's Wall Street peers made their money this week: trading and capital markets.
Balance sheet metrics were mixed, with capital the weak spot:
- Return on average equity 9.41%; return on average assets 0.79%
- Return on average tangible common equity 12.6% (14.9% adjusted, vs 16% in Q1)
- Basel III CET1 ratio, advanced approach, 12%, missing estimate of 12.4%
- Standardized CET1 ratio 10.9%, missing estimate of 11.2%
- Loans $1.25 trillion, beating estimate of $1.23 trillion
- Total deposits $2.04 trillion, in line with estimates
Here is how BofA itself presents the quarter, with the "charge impact" row helpfully doing the heavy lifting. Also it's remarkable how quick Bank of America managed to flow through the "surprise" $1.2 billion charge not only through its financial statements but its presentations too just 12 hours later...
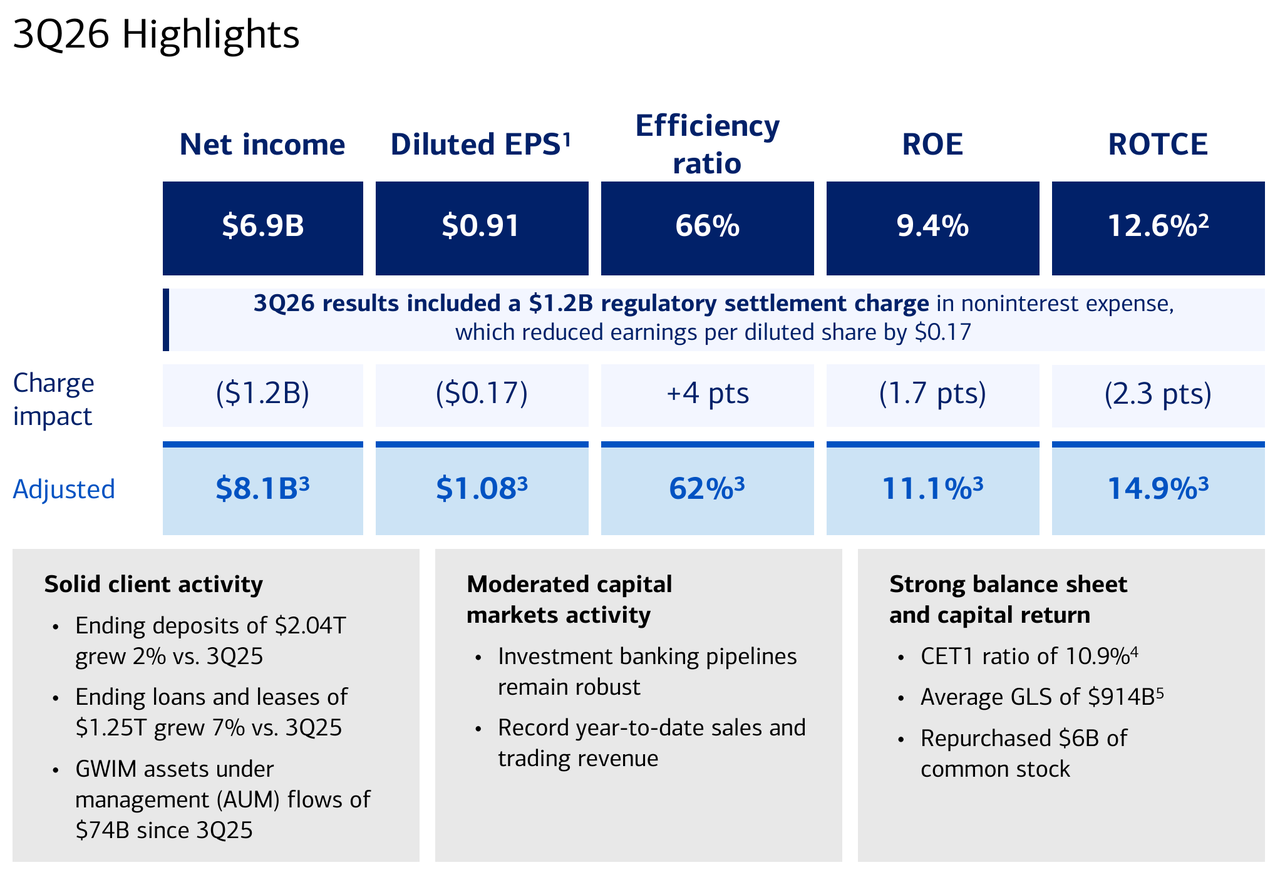
Note the bottom box: "Moderated capital markets activity"... followed by "Record year-to-date sales and trading revenue." Both are technically true but only one of them describes Q3.
The Trading Desk That Missed The Party
On Tuesday, JPMorgan and Goldman both stumbled in FICC but more than made up for it in equities: JPM's stock traders brought in $4.95 billion vs a $4.47 billion estimate, while Goldman's equities desk posted $6.44 billion, crushing the $5.09 billion consensus. Citi's bond traders, meanwhile, had their best third quarter in at least a decade according to Bloomberg.
BofA managed to miss on both sides of the desk. FICC revenue ex-DVA tumbled 17% YoY to $2.55 billion, which the bank blamed on "mortgages, municipals, and credit," a far uglier drop than JPM's 4% decline or Goldman's ~1% dip. Equities rose 10% YoY to $2.51 billion, which BofA calls a "record 3Q"... and which still came in $120 million short of what analysts expected.
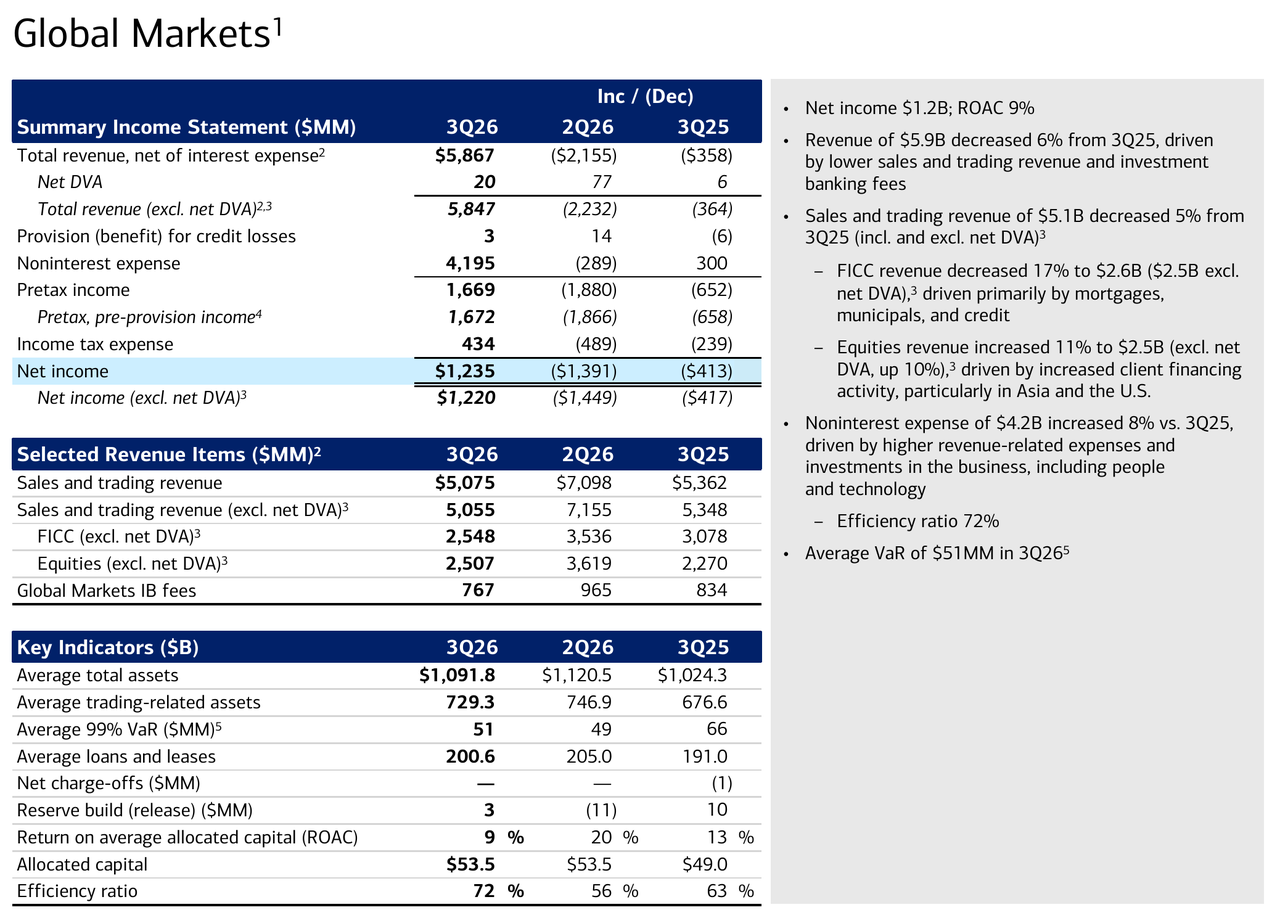
Sequentially, it looks even worse: total sales and trading revenue ex-DVA dropped 29% from Q2's $7.16 billion to $5.06 billion, with FICC down 28% QoQ and equities down 31%. As a result, Global Markets net income collapsed by $1.4 billion QoQ to $1.2 billion, return on allocated capital plunged from 20% in Q2 to just 9%, and the segment's efficiency ratio blew out to 72% from 56% (chart source BofA).
Which brings us to Goldman's bank earnings preview from Tuesday morning. The bank's desk listed the key question for BAC as "Any NII upside updated for the rate curve and can this flow into operating leverage? Trading outlook relative to peers." We now have the answer to the second part: dead last. And Goldman bank analyst Richard Ramsden, who has a Buy on the stock, made the bull case in his Large Cap Banks preview (available here for pro subs) in part on BofA's lower sensitivity to Wall Street's revenue cycle:
We remain constructive on BAC's NII trajectory through 2026E/27E, and view the high end of the 2026 guidance as achievable with potential upside as well, especially driven by a better NIM outlook. Further, given BAC's asset sensitivity, and less exposure to capital markets revenue risk, we see an increasingly attractive top-line growth story.
Diversification at its finest: the less-exposed business is the one that missed by 6.5%.
Dealmaking: "Pipelines Remain Robust" (Fees, Less So)
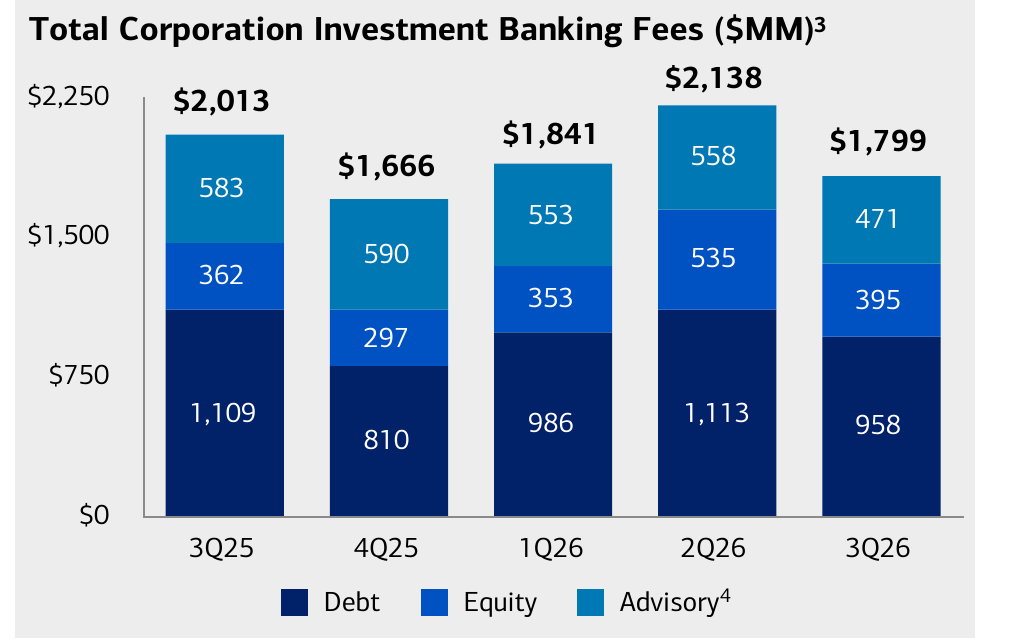
Investment banking was the one capital-markets line that technically beat, with fees of $1.80 billion edging out the $1.77 billion estimate thanks to debt underwriting ($958 million vs $920 million expected). But the trend is hardly flattering: total IB fees fell 11% YoY and 16% QoQ, with advisory down 19% from a year ago to $471 million and equity underwriting short of estimates at $395 million. BofA's slide promises that "investment banking pipelines remain robust," which is what every bank says right before the fees fail to show up (chart source BofA).
This fits with Goldman's preview framing of whether Q3 was "just an air pocket or a signal of a more prolonged slowdown to come" as rising yields weigh on deal activity. With the 10Y knocking on 5% and Warsh's Fed eyeing hikes, we know which way we'd lean.
NII Delivers, Expenses Eat It
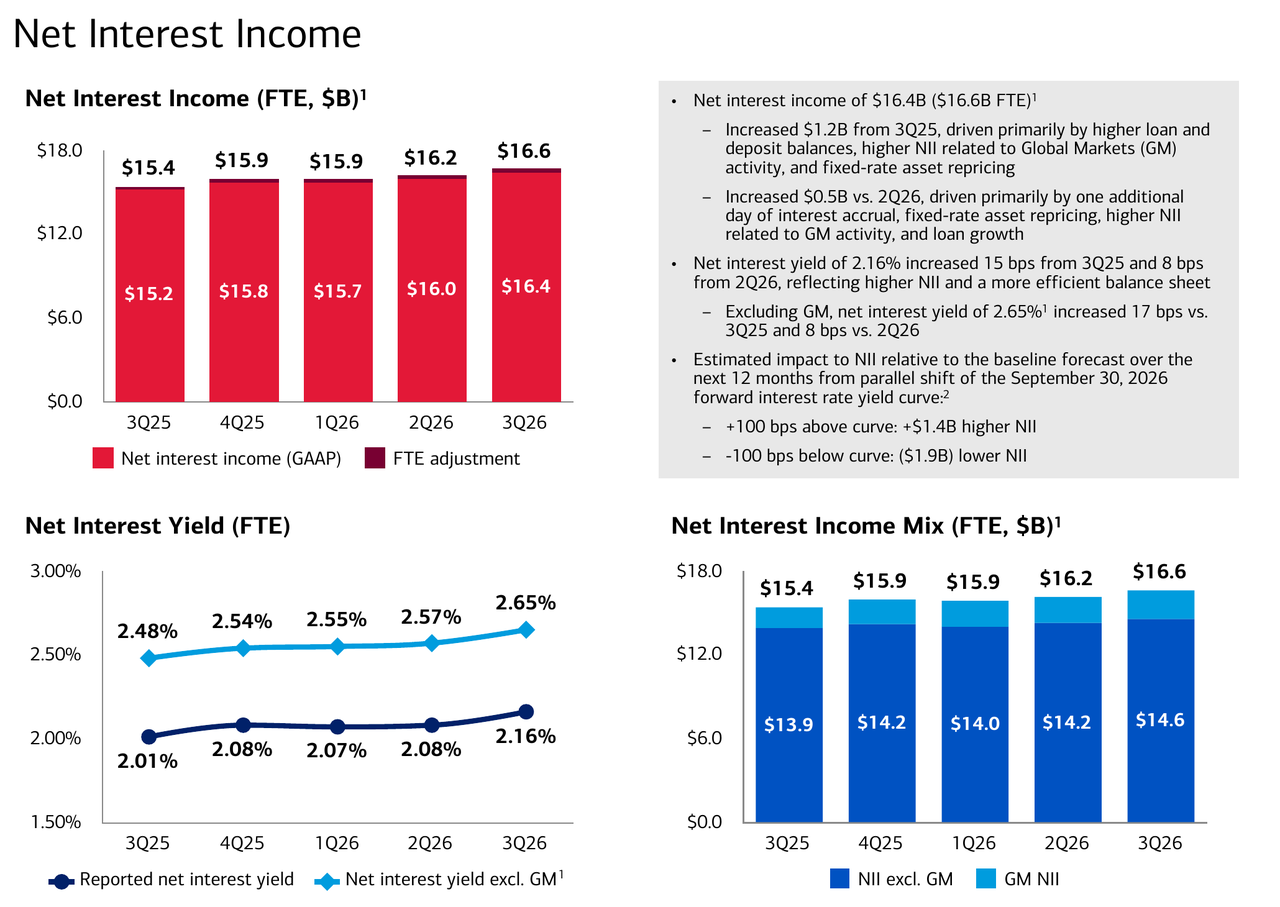
The good news, and the reason the stock isn't down even more, is net interest income. NII rose 8% YoY to $16.4 billion ($16.6 billion FTE), beating estimates, and the net interest yield jumped 15bps from a year ago to 2.16%, ahead of the 2.11% expected. Rising rates finally work in BofA's favor: the bank estimates a parallel +100bp shift in the curve would add $1.4 billion to NII over the next 12 months, while a -100bp shift would cost it $1.9 billion. Some $2.0 billion of the NII came from Global Markets, up from $1.5 billion a year ago (chart source BofA).
The bad news is the other half of Goldman's question: whether NII upside "can flow into operating leverage." Not this quarter. Total revenue rose $0.9 billion, or 3%, YoY. Adjusted noninterest expense (i.e. excluding the fine) rose $1.2 billion, or 7%, to $18.5 billion, "driven by revenue-related expenses and investments in technology and brand." Costs grew more than twice as fast as revenue, pushing the adjusted efficiency ratio up to 62% from 60% a year ago; including the penalty, it hit 66% (chart source BofA).
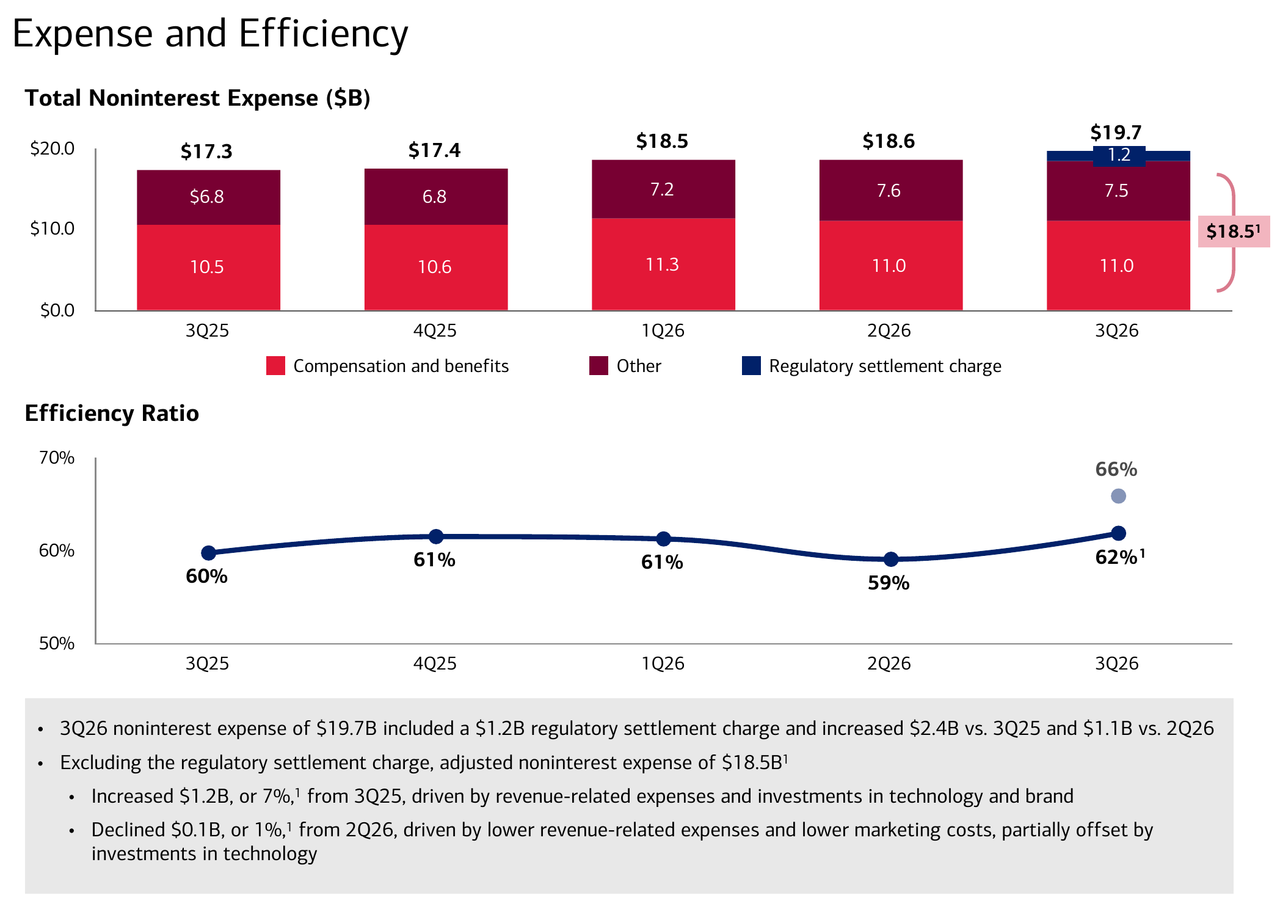
Good news for shareholders: compensation expense of $10.97 billion came in slightly below the $11.08 billion estimate. Traders who missed by 6.5% might see it differently (at least the one who aren't replaced by a chatbot).
Capital: Paying Out More Than It Earns
The CET1 miss deserves more attention than it will get. The standardized CET1 ratio fell 37bps QoQ to 10.9%, below the 11.2% estimate, as CET1 capital dropped $3 billion to $198 billion while risk-weighted assets rose $32 billion to $1.82 trillion. Meanwhile, BofA paid $2.2 billion in dividends and repurchased another $6.0 billion of stock, a total of $8.2 billion returned in a quarter when it earned $6.9 billion. The share count is down 5.6% in a year to 6.92 billion, which flatters per-share numbers. That math only works for so long, and Goldman already flagged "less excess capital... and higher rates impacting AOCI" as a reason buybacks could slow at the money centers.
Credit And The Consumer: The One Clean Spot
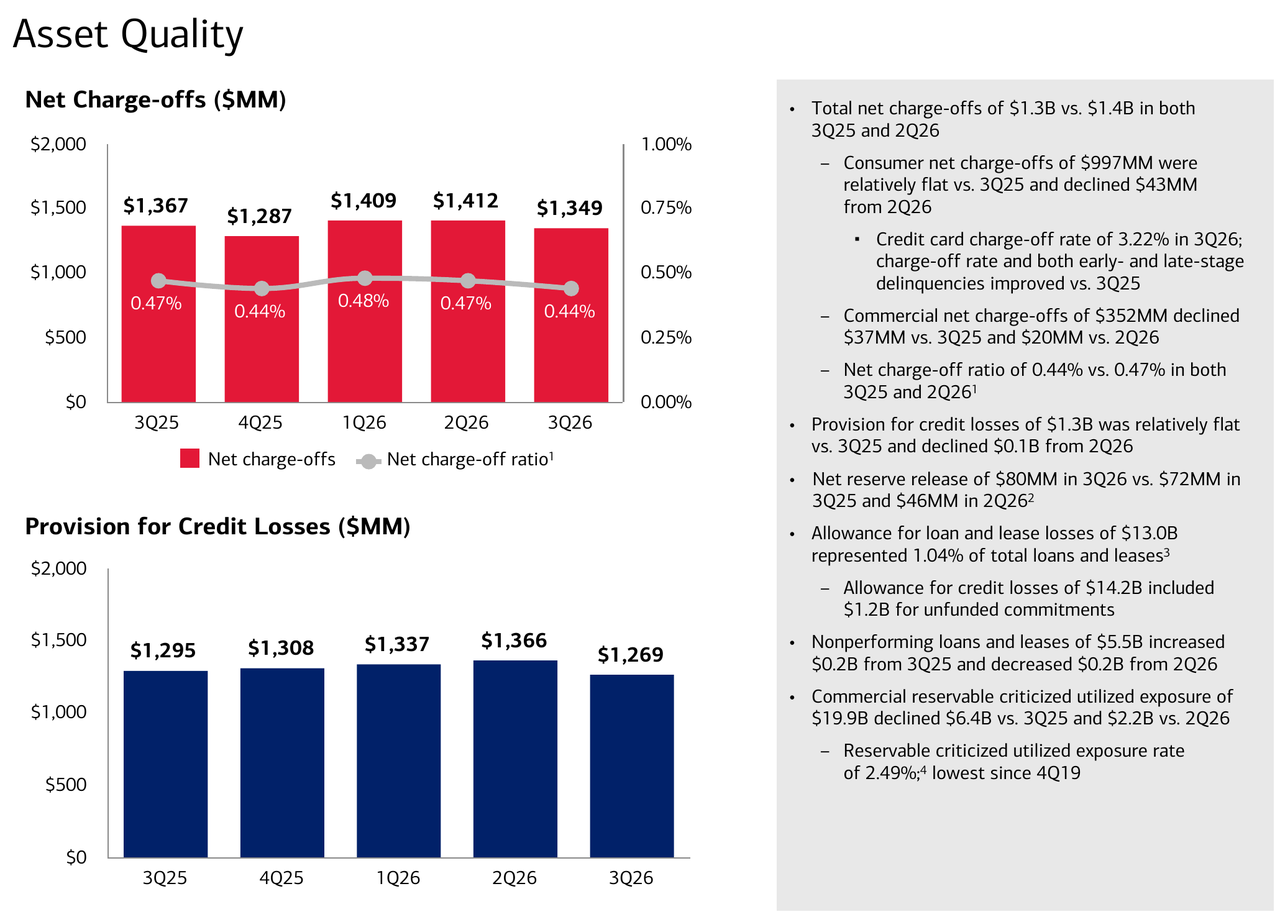
Asset quality was the bright spot. Provision for credit losses dropped to $1.27 billion, well below the $1.49 billion estimate, while net charge-offs fell to $1.35 billion from $1.41 billion in Q2, below the $1.44 billion expected. BofA released a net $80 million of reserves, and the credit card charge-off rate improved to 3.22%. Commercial reservable criticized exposure dropped to $19.9 billion, with the criticized rate of 2.49% the lowest since 4Q19. One small blemish: consumer loans 30+ days past due rose to $4.58 billion from $4.49 billion a year ago, even as 90+ day delinquencies fell (chart source BofA).
"Asset quality continued to improve and liquidity and capital remained strong," CFO Alastair Borthwick said. The first part is true; see above for the second.
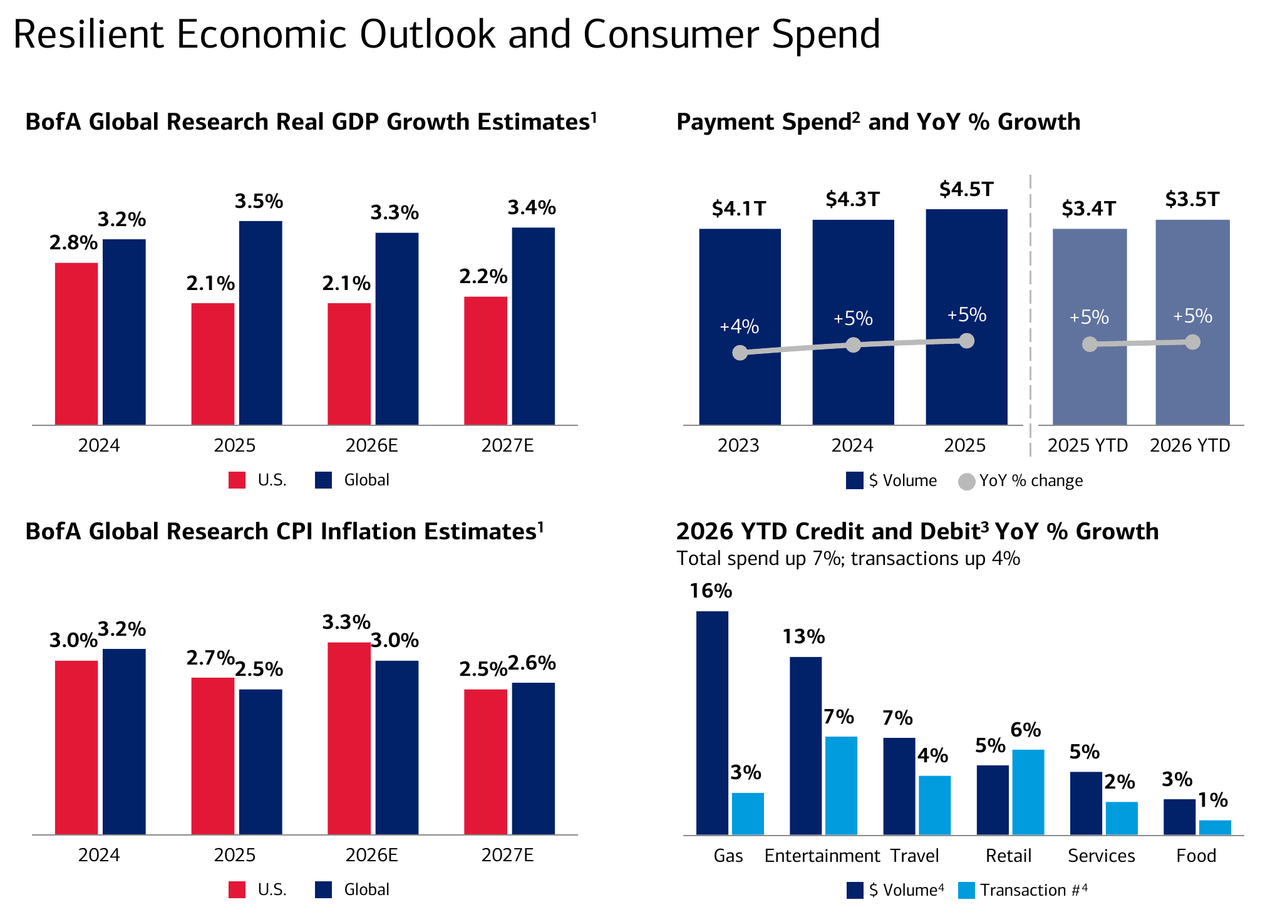
As for the consumer, BofA's spending data still shows a population that is spending, if mostly on things it can't avoid. Combined credit and debit card spend rose 8% YoY to $266 billion, while year-to-date card spending on gas is up 16%, more than double the 7% increase in total spend, courtesy of the Iran war oil shock. That is the same 16% pace the bank flagged for March back in April, so six months later the pain at the pump hasn't eased (chart source BofA).
Bottom Line
Six months ago, BofA jumped on record equity trading revenue and a higher NII forecast. This quarter, NII once again did its job, but the trading desks missed on both FICC and equities in a quarter when their competitors' stock traders printed money, costs ran more than twice as fast as revenue, and capital ratios slipped below expectations as buybacks outran earnings.
And then there is the fine. Management will spend the 8:30am call talking about the "$1.2 billion regulatory settlement charge," which is a convenient thing to talk about since it is excluded from the adjusted numbers. But the adjusted numbers missed too. As we said last night, the dollar amount was never the real story: the bank that Treasury says "prioritized its revenues" over compliance (a problem it first disclosed back in October 2024) just reported a quarter where the revenues didn't show up either. And with the independent lookback and reviews still ahead, this is unlikely to be the last "one-time" item.
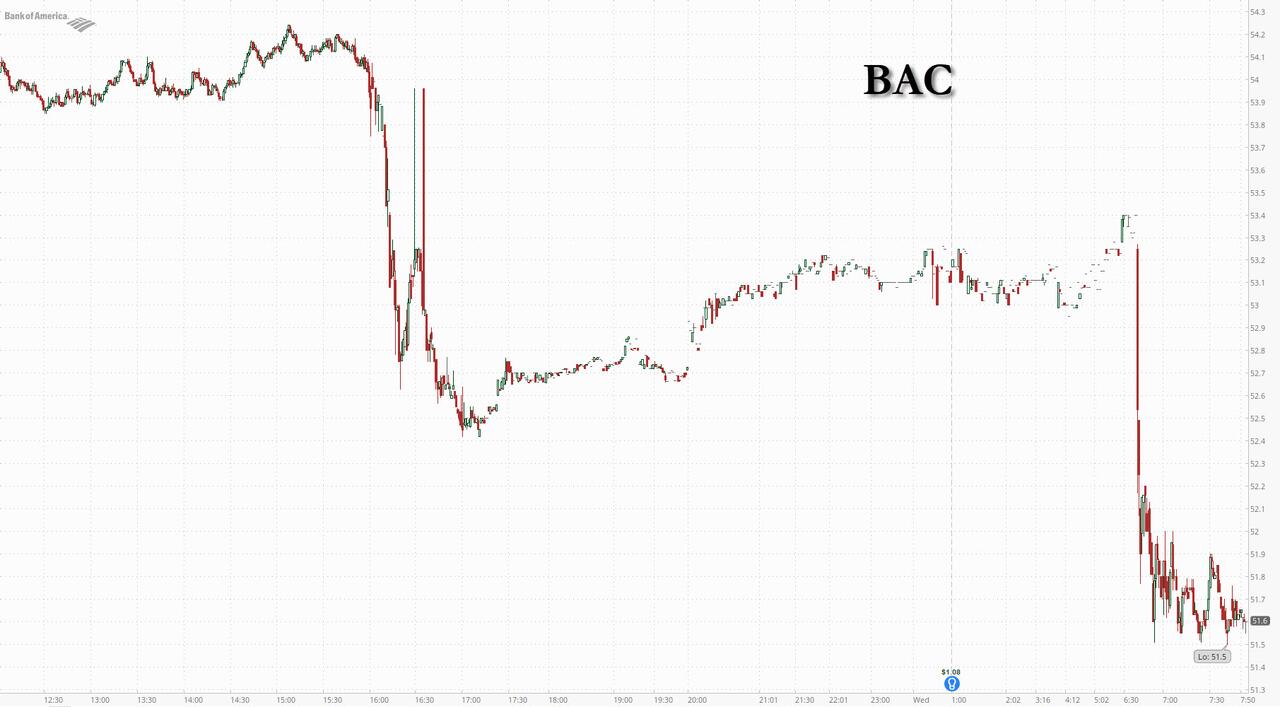
BAC shares were down 4.2% premarket (including the after-hours slide on the fine), after already dropping 1.2% on Tuesday, putting the stock around $51.70, roughly 20% below its 52-week high of $65.22. Goldman's Ramsden still has a Buy on the name. After today, the NII story is the only part of that thesis that is left.
The full BofA Q3 presentation is below (pdf link)