The Consumer Expenditure Survey (CEX) now covers forty years worth of data for how Americans households spend money.
That data includes how much the average "consumer unit" surveyed by the U.S. Census Bureau spends on health insurance, which like many other things in the economy, has seen significant cost inflation over the past four decades.
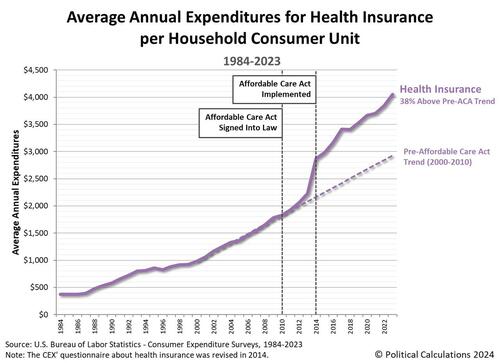
The following chart, via Political Calculations blog, shows how that cost has changed from 1984, the first year for the CEX, through 2023, the latest, whose data was just released last month.
As you'll see, over the past 40 years, there has been one major factor that has altered the trajectory for how much American households/consumer units pay on average for health insurance coverage.
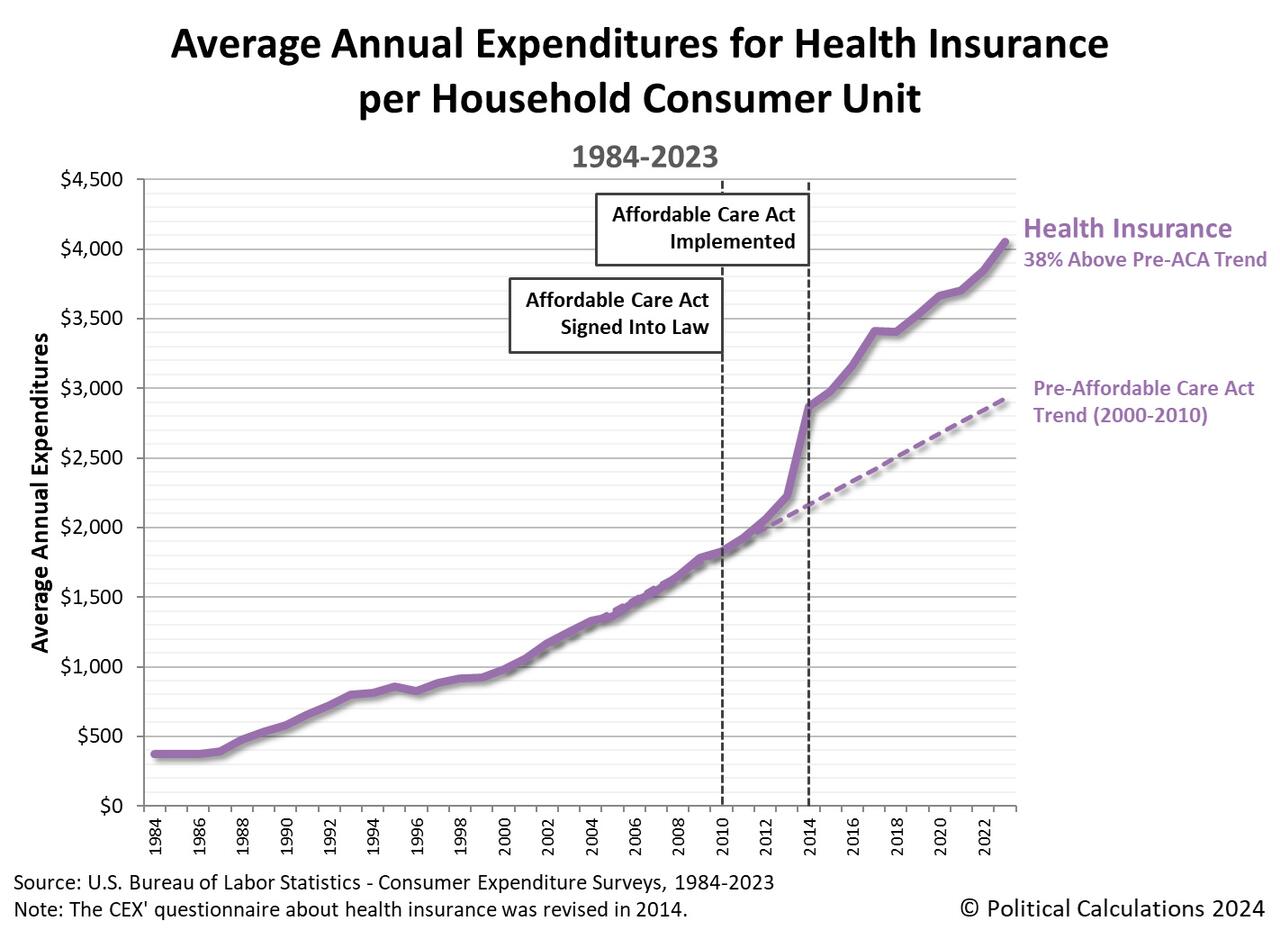
Back in 1984, the first year for the CEX, American household consumer units paid an average of $370 for health insurance.
That figure grew steadily over the following years and by 2000, the average cost of health insurance for a U.S. household has risen to $980.
From 2000 through 2010, the average cost of health insurance grew faster, reaching $1,826 by 2010.
Had the 2000 through 2010 growth trend continued, we estimate the average amount American households would pay for health insurance in 2023 would be $2,927.
But it didn't, thanks to the passage of the Affordable Care Act, which was signed into law in 2010.
It was implemented over several years, going into full effect in 2014.
The claimed goal of the law, as suggested by its name, was to make health insurance more affordable for Americans.
In 2023, the average cost of health insurance paid by American households has more than doubled what it was in 2010.
At an average $4,049 per household, this expense is more than 38% higher than the trend that existed in the decade before the Affordable Care Act became law.
The chart also indicates the cost "curve" for health insurance has bent upward since 2021, which has inflated more quickly over the last few years following 2020's coronavirus pandemic.