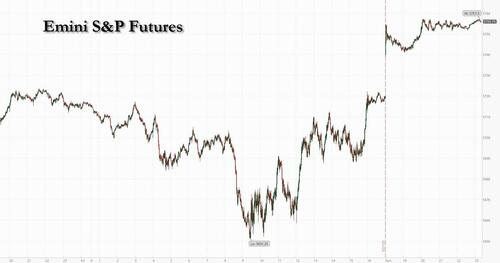
A Bloomberg article dropped yesterday and it suggests that the new tariffs on April 2 are poised to be more targeted than originally feared; this is helping spark a risk on move across global markets, and push US futures about 0.7% higher late on Sunday.

According to the report, "Trump is preparing a “Liberation Day” tariff announcement on April 2, unveiling so-called reciprocal tariffs he sees as retribution for tariffs and other barriers from other countries, including longtime US allies. While the announcement would remain a very significant expansion of US tariffs, it’s shaping up as more focused than the sprawling, fully global effort Trump has otherwise mused about, officials familiar with the matter say.
Trump will announce widespread reciprocal tariffs on nations or blocs but is set to exclude some, and — as of now — the administration is not planning separate, sectoral-specific tariffs to be unveiled at the same event, as Trump had once teased, officials said."
So while we wait for more color about what Trump will unveil on Liberation Day, below we share the latest thoughts from Goldman trader John Flood on where we stand right now:
* * *
S&P clawed back 51bps last week for its first positive week since Valentine’s Day. After listening to Jay Powell on Wednesday I got the sense that the Fed Put is creeping back into the market. It is worth noting that we ended last week with Thursday (3/20) as the lightest trading volume session of the year (13.1b shares traded across all US exchanges) followed by Friday (3/21) as the highest (21.03b shares as a result of triple-witch). Friday’s MOC of +$8.1b to buy was outsized and hints at footprints of CTAs (short covers) and Pensions (+$30b Q end rebal getting started early).
I am watching for the S&P 500 to trend towards its 200dma of 5750 this week. It will be difficult to break significantly higher from the 200dma until we see longer duration investors step in as buyers (which is unlikely to happen before 4/2). Looking at aggregated 1-delta flow executed across our franchise last week the Long Only community finished with a net sell skew of -430bps (80th percentile of last 1 yr....AKA still not buyers).

This stat from our weekly PB data stood out to me: US-listed ETF shorts decreased -4%, the largest week/week covering in nearly 4 months, led by covering in Small Cap Equity, Large Cap Equity, Corporate Bond, and Sector ETFs.
Much has been made of US Fundamental L/S Gross Leverage remaining stubbornly high (204% ...82rd percentile on 1 yr look back and 96th on 5 year). However, Net leverage has moved SHARPLY lower (49%....2yr low and 8th percentile on 5 yr look back). Aggregate Long/Short ratio – the ratio of longs over shorts held US Fundamental L/S (in MV terms) – has fallen to the lowest level in more than 5 years (see "Sentiment Will Swing Day-To-Day Until Investors Clear The April 2 Tariff Hurdle")

Our PB data shows HFs as sellers of international equities: both European and Chinese equities saw risk unwinds in the past month, led by long sales, suggesting HFs have been taking profits after the sharp price outperformance in those markets. China (onshore and offshore combined) was the most notionally net bought market globally on the Prime book thru mid-February but is now modestly net sold YTD.
Last week HFs also net sold European equities for the 2nd consecutive week, driven entirely by short sales, primarily in Single Stocks. The region has now been net sold in 4 of the last 5 weeks and is net sold on a YTD basis. Gross/Net allocations to European equities now stand at 18.3% / 21.6% of total Prime book exposure, which ranks in the 66th / 75th percentiles vs. the past year and in the 93rd/94th percentiles vs. the past five years.
This chart caught my eye and I think we will see some meaningful reversion on both legs here. Per GSPB data Net allocations to North America and Europe are at their respective 5-year lows and highs...

Another great note from our portfolio strategy research team revisiting the role of foreign investors in the US equity market. Long-term data from the Fed show foreign ownership of US equities stands at an ATH. Foreign investors owned just 2% of US equities in 1960 and 7% in 2000 but 18% of US equities at the start of 2025. 49% of foreign holdings are from investors in Europe.

The sharp downgrade in the pricing of US economic growth and the underperformance of the S&P 500 (-3% YTD) relative to Europe's STOXX 600 (+9%), China's CSI 300 (+1%), and Japan's TOPIX (flat) have prompted investors to inquire about the potential for foreign investor outflows.
We forecast foreign investors will remain buyers of US equities this year. The weaker USD and relative underperformance of US stocks lead us to forecast foreign investors will buy $300 billion of US equities in 2025 compared with $304 billion in 2024. In 2025, we forecast corporates will be the largest buyer of equities (+$675 billion) followed by households (+$425 billion). Mutual funds will be the largest seller of US equities (-$550 billion) followed by pension funds (-$250 billion).

More in the full Goldman note available to pro subs.
Loading...