On a day when the 10Y TSY yield briefly topped 5%, here is a remarkable stat from DB's Jim Reid: as the DB strategist writes in his Chart of the Day note, after this week’s latest bond sell-off, there is now no fixed income asset that has outperformed USD cash amongst the main assets DB uses in its monthly performance review.
The last holdout was US HY and with this week’s bond sell-off, the return of the iBoxx US HY index has dipped below the return of US T-bills YTD. While US junk had until recently been seen as a strong performer this year, the returns show how difficult it is for any duration to perform in a sell-off, especially in a heavily inverted curve environment where carry is negative for government bonds relative to cash.
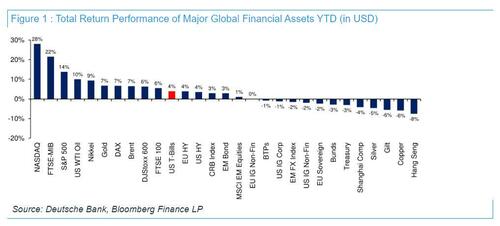
Reid's chart below is an abridged selection from the bank's performance review showing where T-bills rank YTD in USD terms. As discussed, it now eclipses all DB's main global fixed income indices. To outstrip it you have to go into selected equities, Oil or Gold.
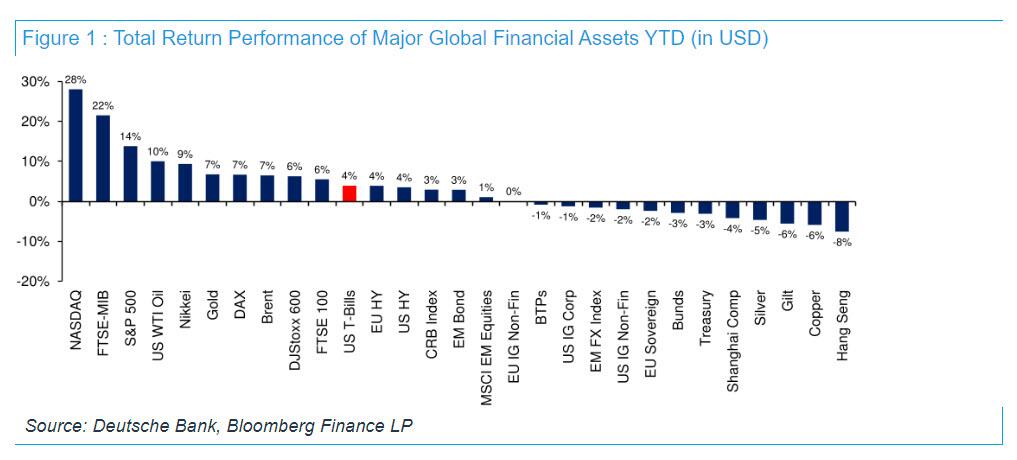
Clearly, the NASDAQ (+28.1%) has trounced everything and has taken the S&P (+13.8%) with it. However, the equal weight S&P 500 has underperformed cash at just under 1% return YTD in total return terms, in other words aside for AI or Obesity-linked stocks, 2023 has been a dismal year.
The interesting thing, according to Reid, is if you’d told most people at the start of the year that 10yr yields would be around 5% by October, not many people would have wanted to own the NASDAQ given the near one-to-one negative correlation to yields in prior quarters. So AI has helped create a dramatic decoupling.
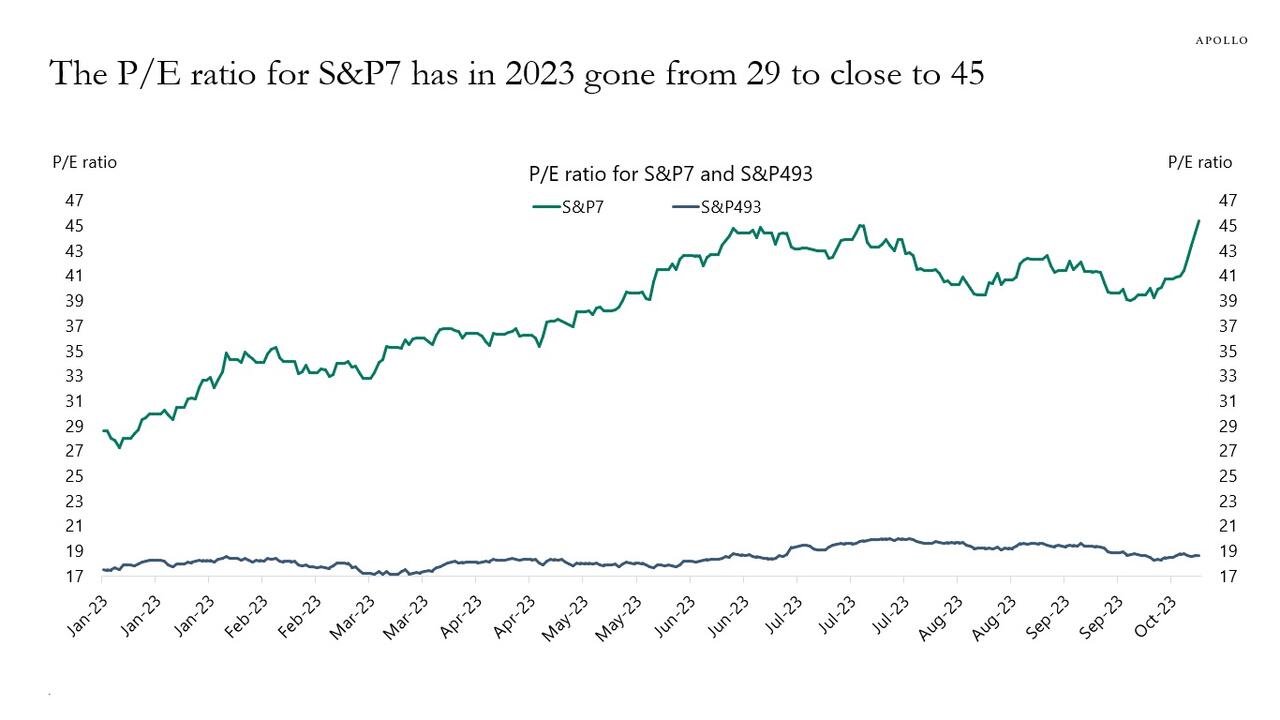
Tangentially, this reminds us of another Chart of the Day, this time from Apollo's Torsten Slok (and a former colleague of Jim Reid) who looked at the PE multiples of the S&P7 and the S&P 473. As Slok calculates:
- The P/E ratio for the S&P493 has fluctuated around 19 in 2023.
- And the P/E ratio for the S&P7 has increased from 29 to 45, see the first chart below.
The bottom line, Slow writes, is that "returns this year in the S&P500 have been driven entirely by returns in the seven biggest stocks, and these seven stocks have become more and more overvalued." Of course, we already knew that.
Another remarkable observation from Slok that ties in with what Reid wrote, is that the ongoing overvaluation of tech stocks has happened "during a year when long-term interest rates have increased significantly. Remember, tech companies have cash flows far out in the future, which should be more negatively impacted by increases in the discount rate."
Slok's conclusion is that "tech valuations are very high and inconsistent with the significant rise in long-term interest rates, see the second chart."
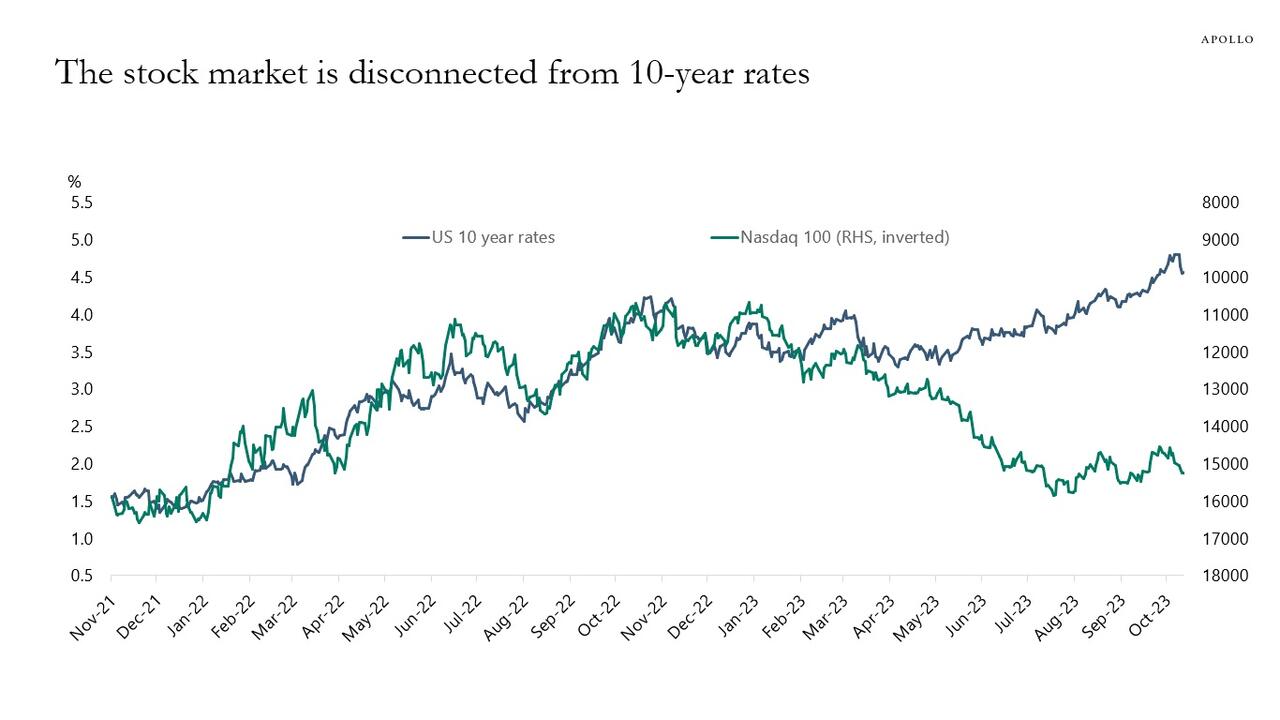
In short, something has to give. Either stocks have to go down to be consistent with the current level of interest rates. Or long-term interest rates have to go down to be consistent with the current level of stock prices.
Finally, going back to Reid, the good news is that yields are higher across the board, so positive returns from here should get easier in fixed income (and is why Goldman is now buying calls on 10Y Treasuries). However, with credit spreads still very tight, spreads would likely widen more than government bonds rally in a recession so one still needs to have a soft landing to get maximum benefit.