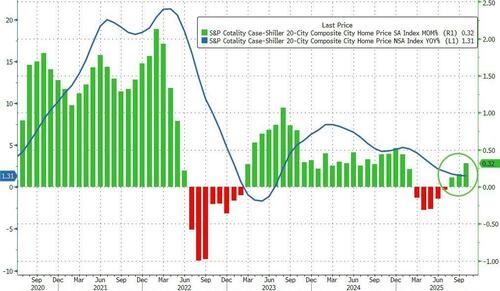
Home prices in America's largest 20 cities surged 0.32% MoM in October (far higher than the +0.1% MoM move expected) but for context, this is the weakest annual home price growth since the March through July 2023 period, when the market was absorbing the initial shock of the Fed’s rapid rate hikes

Source: Bloomberg
“October’s data show the housing market settling into a much slower gear, with the National Composite Index up only about 1.4% year over year – among the weakest performances since mid-2023,” said Nicholas Godec, CFA, CAIA, CIPM, Head of Fixed Income Tradables & Commodities at S&P Dow Jones Indices.
"This broad stagnation suggests that elevated mortgage rates – still hovering around the mid-6% range in late October – are finally overwhelming the market’s earlier supply-driven resilience. Would-be buyers are facing the highest borrowing costs in decades, and that affordability squeeze has curbed demand enough to erode price momentum across most of the country."
But could be set to improve in the (lagged) months ahead...

Source: Bloomberg
Regional performance underscores a striking geographic rotation.
Chicago now leads all major markets with a 5.8% annual price gain, followed by New York at 5.0% and Cleveland at 4.1%. These traditionally stable Midwestern and Northeastern metros have sustained solid growth even as broader conditions soften.
By contrast, Tampa home prices are down 4.2% year over year – the steepest drop among the 20 cities, marking Tampa’s 12th consecutive month of annual declines. Other former highflyers in the Sun Belt are similarly struggling: Phoenix (-1.5%), Dallas (-1.5%), and Miami (-1.1%) all remain in negative territory.

As Godec notes, "it’s a stark reversal from the pandemic boom, as the markets that were once ‘pandemic darlings’ are now seeing the sharpest corrections while more traditional metros continue to post modest gains."
Loading recommendations...