Authored by Mike Shedlock via MishTalk.com,
Buy Now Pay Later, BNPL, plans are increasingly popular. It’s another sign of consumer credit stress.
The office of the Comptroller of the Currency defines BNPL as “loans that are payable in four or fewer installments and carry no finance charges.” They are generally offered to online shoppers at checkout.
The New York Fed discusses How and Why Do Consumers Use “Buy Now, Pay Later”?
We differentiate between two types of respondents: 1) the financially fragile, whom we define as having a credit score below 620, having been declined for a credit application in the past year, or having fallen thirty or more days delinquent on a loan in the past year, and 2) all other respondents, whom we refer to as financially stable.
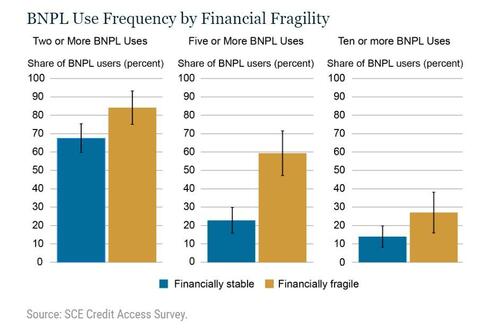
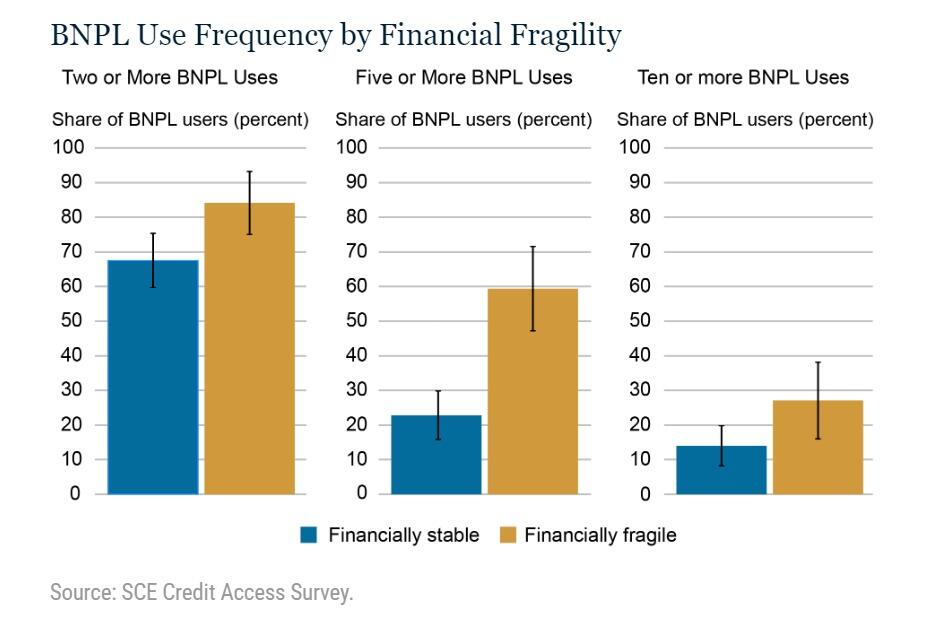
We find that the financially fragile are disproportionately likely to use BNPL at higher frequencies and appear to have embraced BNPL as a regular payment option. Among financially fragile BNPL users, about 60 percent have used the product five or more times in the past year, which translates to about 18 percent of all survey respondents deemed financially fragile (which includes those who have not used BNPL in the last year). This implies that financially fragile users are almost three times as likely as financially stable users to use BNPL five or more times and suggests that high-frequency use may grow if the product continues to be adopted by financially fragile households.
While about 68 percent of financially stable BNPL users have taken advantage of the product at least twice in the past year, just 23 percent and 14 percent have used it five or more times and ten or more times, respectively. This reveals that use by the financially stable tends to drop off substantially after a few instances, but that there is a small group of financially stable individuals who use BNPL frequently.
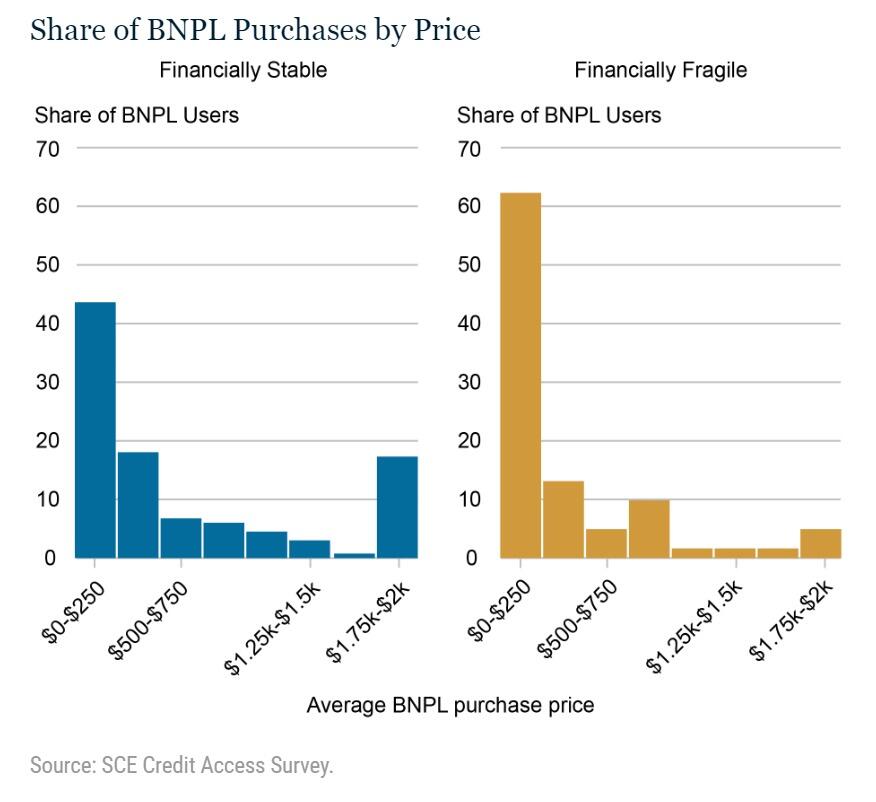
Another distinguishing factor between the two groups is the size of the purchases they make. While both groups are skewed toward relatively smaller purchases, 62 percent of financially fragile users have a mean purchase price under $250, compared to about 44 percent of the financially stable Looking at the rest of the distribution, this gap is largely made up in the right tail, as financially stable households are significantly more likely to have a mean purchase price between $1,750 and $2,000.
For the financially stable, BNPL use appears to be more centered on a few purchases and seems to be largely driven by a desire to avoid paying interest on high-priced items. Meanwhile, use among the financially fragile appears to be more akin to a credit card, as shoppers use the service to make medium-size, out-of-budget purchases frequently.
Our results also have implications for future BNPL use. They suggest that the largest barrier to consumer take-up is their first use, and that after this initial use consumers tend use BNPL again. With about 80 percent of households not using BNPL in the past year, there may still be a great deal of room for increased adoption of the product. This will be particularly important to watch in the coming months, as many shoppers used BNPL for the first time this past holiday season.
The Trap
If you use BNPL and pay off the bill in the allotted time, you avoid financing. Plans vary, but if you miss a payment, interest likely accrues from the initial purchase.
It’s one thing to spread a major purchase over time, once or twice, and another to be spreading routine purchases over time.
Home Owners vs Renters
The study did not break things down by home owners vs renters, but I suspect most of the use is by renters.
For the 29th consecutive month rent was up at least 0.4 percent. Shelter, a broader category, rose 0.6 percent. Food rose 0.4 percent.
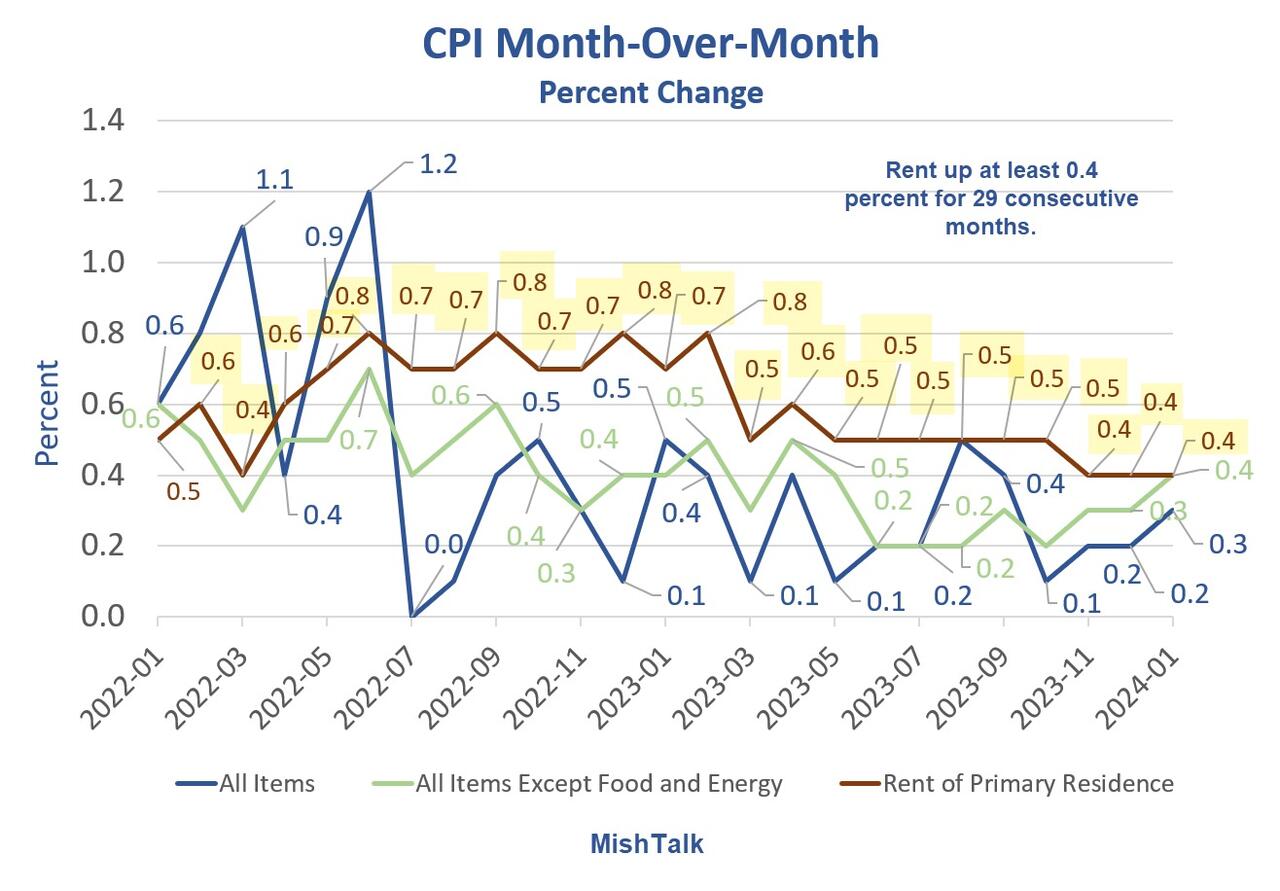
CPI data from the BLS, chart by Mish
Whereas home owners have a fixed payment, likely refinanced lower than their initial mortgage, renters faces huge increases, not every month, but once a year, big bang.
For discussion please see Another Hotter Than Expected CPI Led by Shelter, Up Another 0.6 Percent
For homeowners paying a fixed mortgage, wage increases have likely kept up with inflation. For renters, every rent lease renewal has mostly been a disaster.
Credit card debt at a record high is another sign of financial stress, So are delinquencies.
Credit Card and Auto Delinquencies Soar
Credit card debt surged to a record high in the fourth quarter. Even more troubling is a steep climb in 90 day or longer delinquencies.
![]()
On February 8, I noted Credit Card and Auto Delinquencies Soar, Especially Age Group 18 to 39
Those age 18-39 are most likely renters. This all ties together in a cascade of delinquencies.