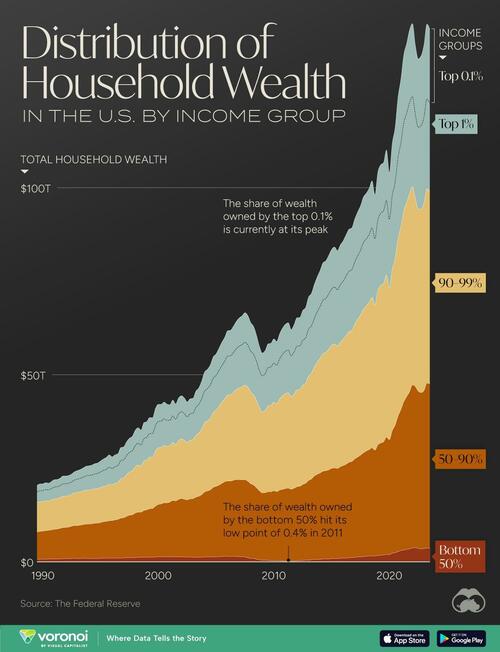
Wealth distribution in America has become increasingly concentrated since 1990.
Today, the share of wealth held by the richest 0.1% is currently at its peak, with households in the highest rung having a minimum of $38 million in wealth. Overall, roughly 131,000 households fall into this elite wealth bracket.
This graphic, via Visual Capitalist's Marcus Lu, charts patterns in U.S. household wealth, based on data from the Federal Reserve.

Below, we show how the share of household wealth breaks down by wealth bracket:
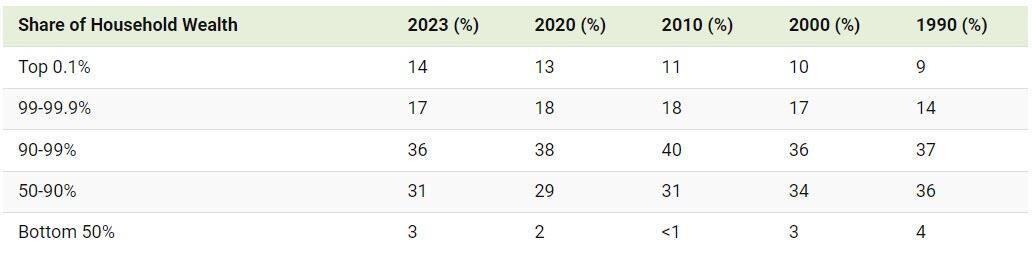
Figures are as of Q4 for each year aside form 2023 where Q3 data was used based on the most recently available data.
With $20 trillion in wealth, the top 0.1% earn on average $3.3 million in income each year.
The greatest share of their wealth is held in corporate equities and mutual funds, which make up over one-third of their assets. Since 1990, their total share of wealth has grown from from 9% to 14% in 2023—the biggest jump across all wealth brackets.
In fact, the richest 0.1% and 1% were the only two rungs to see their share increase since 1990.
Meanwhile, the greatest decline was seen across the 50-90% bracket—households in the lower-middle and middle classes. Those in this rung have a minimum $165,000 in wealth with the majority of assets in real estate, followed by pension and retirement benefits.
Averaging $51,000 in wealth, the bottom 50% make up the lowest share, accounting for 3% of the wealth distribution in America. Income growth across this bracket has increased by over 10% between 2020 and 2022, higher than all other brackets aside from the top 1%.
Overall, the top 10% richest own more than the bottom 90% combined, with $95 trillion in wealth.