On May 13, 2026, the website SecurityBaseline.eu was launched. It is a spin-off from the Dutch “Basisbeveiliging”, which has monitored baseline security for over a decade and is part of governmental policy. Three months ago we sent tens of thousands of e-mails to European governments indicating the new site would launch, giving them time to review the results and act on them in advance of publication.
This article details what SecurityBaseline monitors, how we visualize risks with maps, and dives into three worrisome metrics:
- 3.000 governmental sites use tracking cookies illegally
- Over 1.000 database management interfaces are publicly reachable
- 99% of governmental email is poorly encrypted
This data makes the web transparent and complies with tried-and-tested publication, measurement, and code-of-conduct policy. We target our findings at governments so they can protect their citizens. They can impose requirements on themselves and on the rest of the country.
Do you value transparency, security, sovereignty, accessibility, and privacy? Then ask us to do research or become a member of the Internet Cleanup Foundation and support our mission to improve the internet. We already monitor over 80,000 organisations and 500,000 addresses and make this information available to everyone. Find out more about membership or contact us.
Background: Over a thousand maps updated daily
Web Security Map, our software which powers Security Baseline, has been in development for over a decade. We believe that transparency is fundamental to a secure internet. Transparency includes being able to understand easily whether there is a problem. That’s why we show results on maps: maps for every country and every metric.
We measure all EU member states but also include countries inside the European Economic Area. For administrative purposes, we treat the European Union as a country as well; this helps with plotting pan-European initiatives, Computer Security Incident Response Teams (CSIRT), for example. This totals 32 countries, including the EU, Switzerland, Norway, Iceland, and Liechtenstein. The United Kingdom is not included.
Countries divide themselves into all kinds of regions. Every country takes a different approach. Germany, for example, has a lot of structure. In fact, it has so much structure that it becomes confusing and hard to make maps that can be validated easily as correct. Other countries such as Sweden, are much simpler in that respect. In the end, the 32 countries result in 87 different maps with various types of regions: municipalities, cities, provinces, and so on.
Each of these maps is layered into 21 metrics, which we will dive into shortly. Every night we rebuild all 1827 maps based on the latest metrics we have. Metrics are gathered day and night over all 200.000 internet domains, accross the massive total of 67.000 local governments. Nearly 200.000 seems like a high number, but in fact it is very low.
In reality, the true number of government domains is tenfold but finding those requires a lot of effort. We mostly are missing ‘project’ domains, targeted at tourism, housing, infrastructure, festivals, and anything else the government produces. Some governments, like the Netherlands, have multiple official registries for governmental websites. Yet our Dutch initiative has found thousands of additional domains missing from those registries.
The domains we do measure are the most important ones for each government: their homepage and all subdomains below it. For the Dutch municipality of Amsterdam this includes 700 additional addresses like bikecity.amsterdam.nl and stemmen.amsterdam.nl – those are typical project sites but placed on a subsection of amsterdam.nl.
To alter data on our site; sign up and use change requests. For large change requests, please get in touch.
Traffic Light Maps
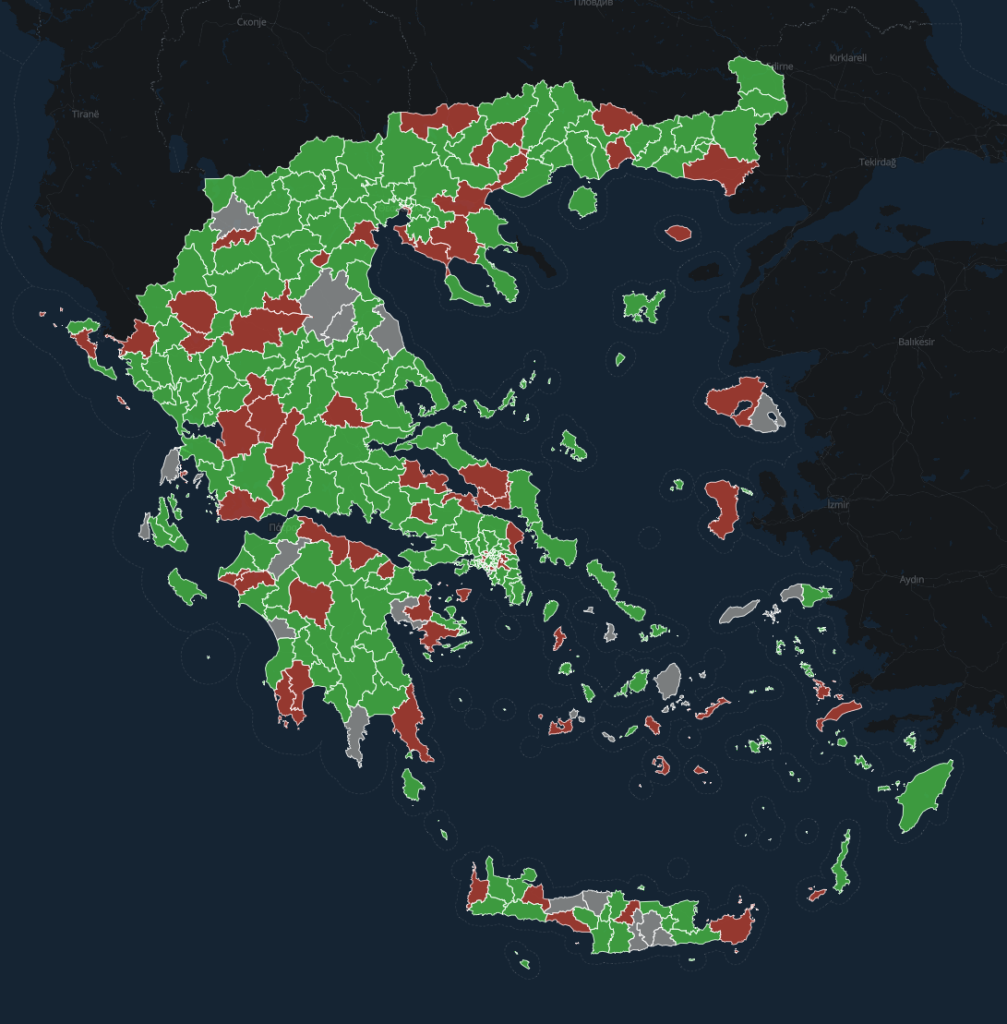
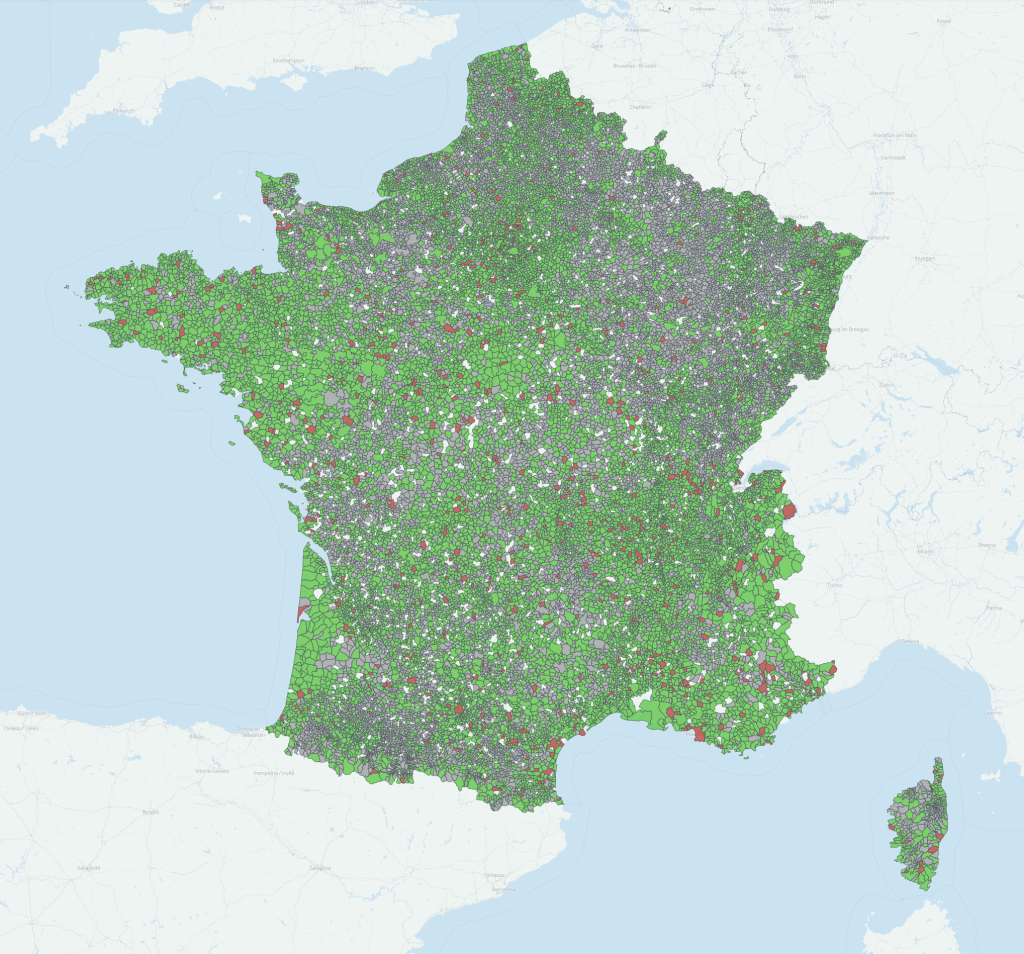
Maps are colored with the colors of a traffic light. Red means there is a security issue, orange means a warning toward a pending security issue that still needs attention, and green means no issues. Only one issue is needed to make something orange or red. This means it can be challenging to be shown as green. We do not use relative grading, as there is no such thing as relative security. Gray means that we have not found online addresses for that region.
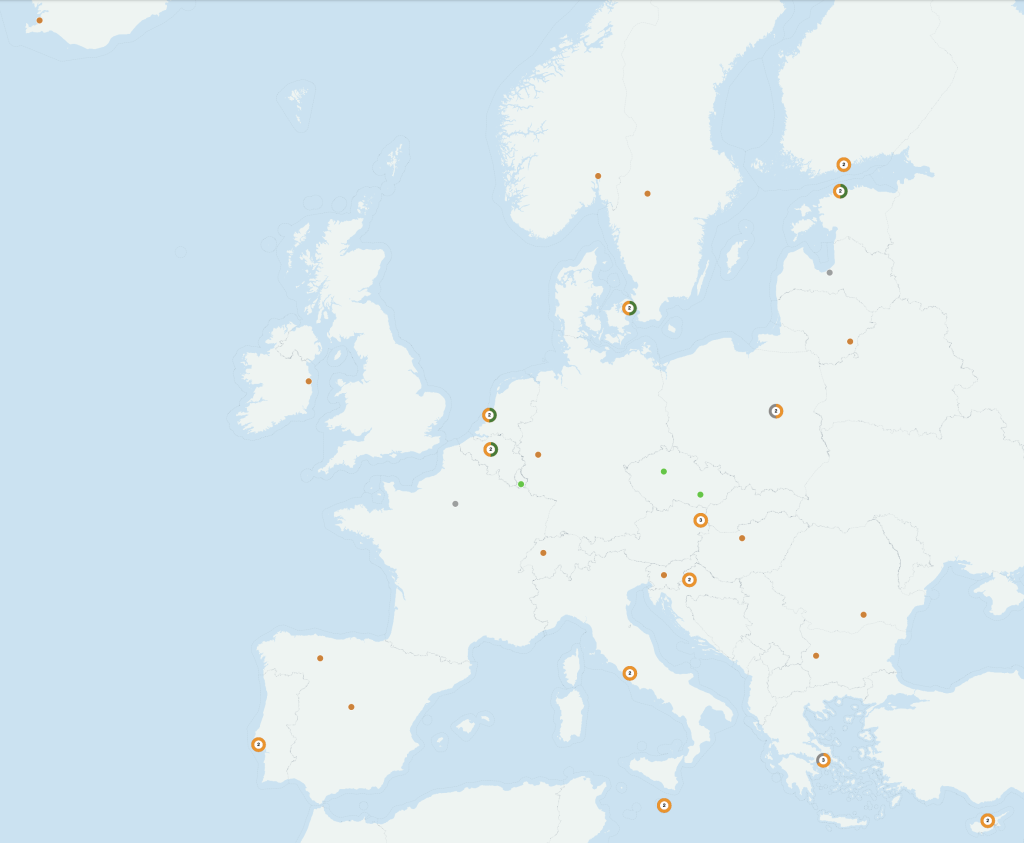
In the galleries below you might recognize your country, and you’ll see a lot of red. It shows the default map for a country, which combines all 21 metrics into one. As you’ll see in the worrisome metrics, there are very large differences between countries.
There are big differences between countries that warrant further analysis. For now, we pick a few highlights:
- Denmark’s municipalities are mostly orange, signifying a policy being in effect.
- Italy has many green municipalities; their trick is to have their municipal site be a subdomain, shifting security issues to higher-ups in the chain. As a result, we measure less.
- EU Computer Security Incident Response Teams are all red; we’ve made it a bit harder for them by connecting the most important governmental website of the country to each of them. This creates a leveled playing field, as some countries do that by design and others have a dedicated website.
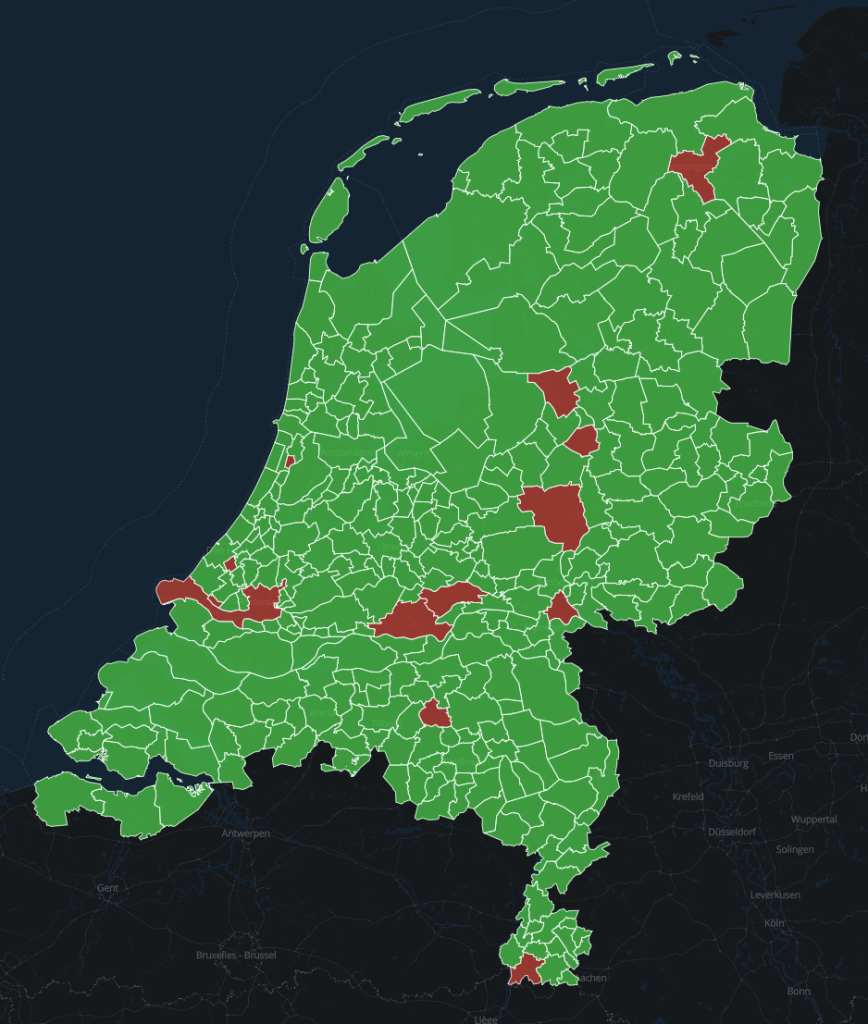
- The Netherlands has a flurry of green, orange, and red; greens are attributed to government policies and measurements of both Basisbeveiliging and Internet.nl.
Map data by OpenStreetMap, metrics and coloring by us.
Three worrisome metrics
Security Baseline measures 21 metrics; these were developed in the past decade for our Dutch site. This number is slowly increasing. We’re using well-established, carefully considered quality tools such as internet.nl and Zonemaster.
From these metrics, we’ve chosen three that cause us the most worry. One of them shows an illegal practice, and the other two show very dangerous practices. These issues need to change not by a single burst of activity but by establishing change processes and continuously upgrading and improving our online footprint. Using a process means you can adapt to future changes we know will come: stronger encryption, quantum cryptography, additional metrics, and new research. Fixing it once does not lead to resilience.
3.000 governmental sites use tracking cookies illegally
3.081 European government sites place tracking cookies without consent. This is illegal, as the GDPR mandates informed consent. The law states: “Consent must be freely given, specific, informed and unambiguous. In order to obtain freely given consent, it must be given on a voluntary basis.” Additionally, there is no reason for a government to use surveillance tech on its citizens in the first place.
Yet, as we’ve seen in the Netherlands, the reason for this tracking is benign and can be replaced by using different technologies and approaches. Mostly it’s a side effect of integrating modern technologies that are simple to use but have a hidden advertising cost. This booklet, written by the EDRi foundation, can help web developers create more privacy-friendly websites.
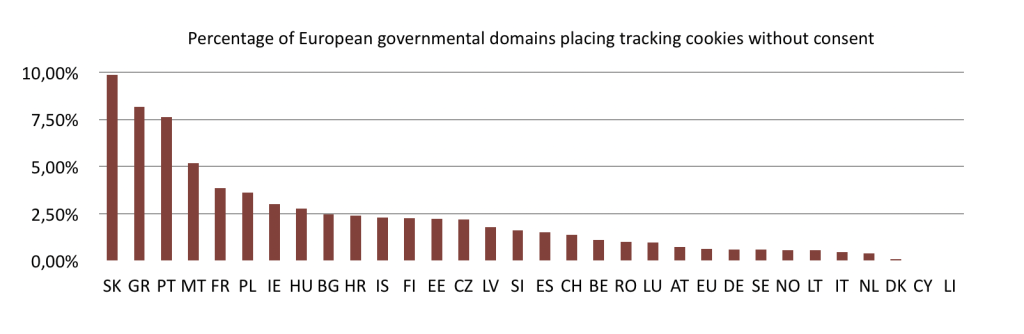
There are substantial differences in tracking between countries. There is no correlation between the number of inhabitants, nor the number of sites. For example; Germany and France differ greatly, with 0,59% versus 3,88% respectively.
What’s missing in these numbers are the tracking cookies of the earlier-mentioned “project” websites for tourism, construction, etc. These are particularly prone to tracking technologies, as they are often made by hip web agencies. Our cookie research in the Netherlands, which did include project websites, showed that in 2023, 4% of governmental sites placed tracking cookies. To protect citizens, it is valuable to have overviews and monitoring of project websites. If we could find them, we’d add them in a heartbeat.
This metric ignores any cookie prompt or banner. Some sites that place these tracking cookies may have a banner like that, but we know from prior research that at least 30% of those banners are ineffective and still leak tracking cookies.
During measurement, we found a total of 357.000 cookies. Just a fraction of these are tracking cookies, and we can say for certain they are in just 10 distinct cases. We found that during prior cookie research in the Netherlands: only large vendors clearly state the intent and purpose of each cookie. Smaller advertising firms do not, so it’s not always clear what every cookie is used for.
For cookies we have a special tracking cookie dashboard on SecurityBaseline. Maps and metrics can also be filtered for tracking cookies with ease.
Below is a number graph of which countries place tracking cookies in order of frequency; source data is at the end of the article. We’ve excluded duplicates from ‘www’ domains.
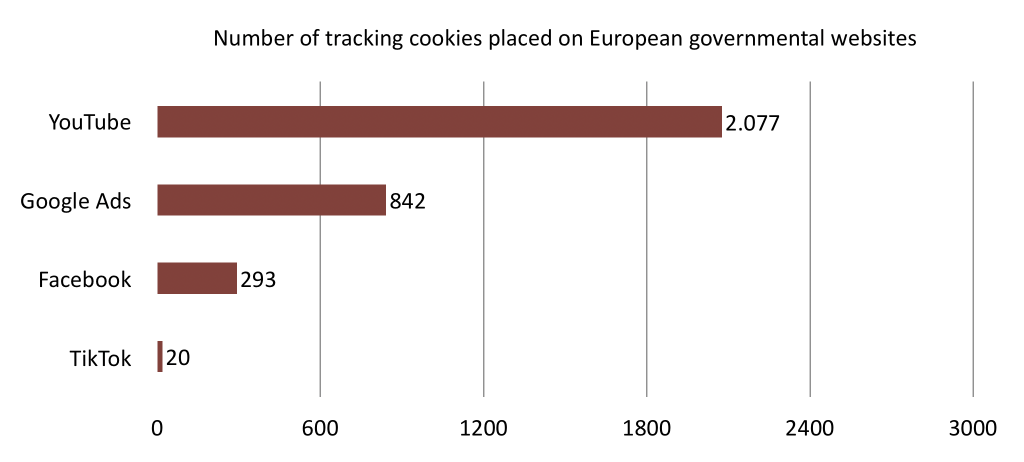
YouTube is the biggest source of tracking cookies, with 2077 cookies placed in total. Google Ads(!) follows with 842 tracking cookies. This might be a side effect of misconfiguration of Google Analytics, which should also not be used; however, that is measured in another metric not mentioned in this article. Then we see 293 Facebook cookies, probably for website analytics as well. Last but not least, we see 20 TikTok cookies.
Here are some maps that show that placement of tracking cookies happens infrequently. Map data by OpenStreetMap.
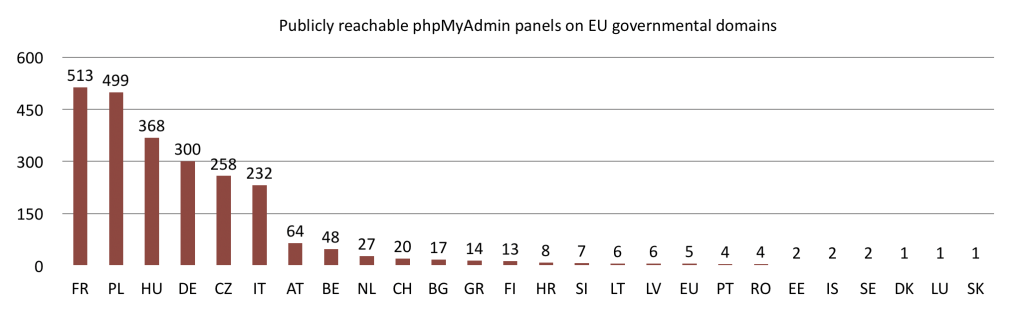
Over 1.000 database management interfaces are publicly reachable
The second worrisome metric is the exposure of admin panels that should not be reachable over the public internet. These types of panels are also prone to security incidents. On April 30th this year, a similar popular product, cPanel, was discovered to have a very severe vulnerability. If those panels are not reachable over the internet, they will cause less harm when vulnerabilities like these are discovered.
SecurityBaseline currently measures only one panel. In the future there will be more, including the aforementioned cPanel. For now, we only measure phpMyAdmin. This particular panel is used for database management purposes. It is a very capable tool for this type of administrative work, which is precisely the reason it should not be exposed on the internet for anything serious.
We found a total of 1.070 phpMyAdmin portals on 3.529 different domains. Many domains share the same panel; they share the same service provider for example. phpMyAdmin is an open-source tool, yet we found no financial contributions from European governments to this software project. This means they are depending on software, yet are not willing or mandated to pay for it; we see this as an unwillingness to invest in their own online security. We urge governments to pay for open source for their own sake.
Two of these panels are present at addresses of Computer Security Incident Response Teams, which is a double offense. It might require some trickery to see these addresses in the browser.
The chart below shows the division of phpMyAdmin panels per country. Again, all www duplicates have been removed.
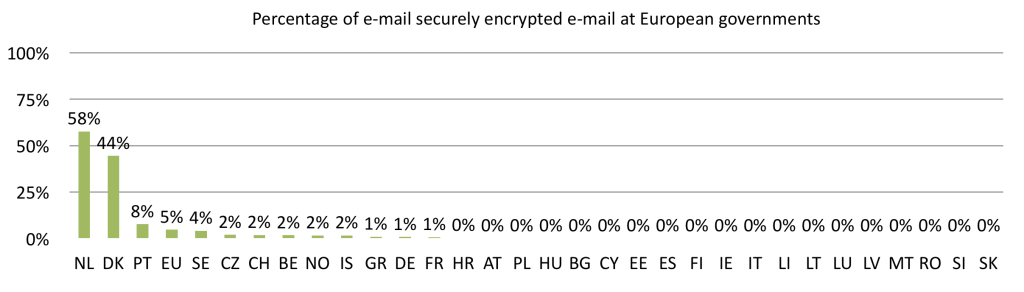
99% of governmental email is poorly encrypted
Last but not least, the most shocking discovery of our research: the encryption quality of e-mail to European governments is poor. And not just any form of poor: as 99% does not follow up-to-date security practices. Only the Netherlands and Denmark show somewhat promising numbers.
Encryption quality is measured with the latest release of internet.nl. Their 1.11 update, released in April 2026, implements the Dutch governmental guidelines for Transport Layer Security. These guidelines were published in May 2025. In short, they state how encryption should work to prevent eavesdropping or tampering with the e-mail message.
This metric consists of 18 submetrics, but not all count toward the category score. Each of these metrics also comes with technical results, for example which version of encryption is supported. These warrant further investigation, as it is interesting why this security baseline is only partially met by the Netherlands and Denmark.
Internet.nl provides ad-hoc tests to see the current status of a particular domain. This is faster than our cycle to update these metrics.
There are no TLS-standards at the European level yet. Other countries, such as Germany and France, wrote other guidelines which are clearly not compatible. Neither do they have simple testing tools available. Instead they point to less convenient open-source command-line tools intended for professionals.
Source Tables
Unique governmental sites with marketing cookies
| Country | Sites with marketing cookies | Percentage of all domains |
|---|---|---|
| SK (Slovakia) | 8 | 9,88% |
| GR (Greece) | 83 | 8,16% |
| PT (Portugal) | 40 | 7,63% |
| MT (Malta) | 4 | 5,19% |
| FR (France) | 1220 | 3,88% |
| PL (Poland) | 621 | 3,61% |
| IE (Ireland) | 3 | 3,00% |
| HU (Hungary) | 247 | 2,78% |
| BG (Bulgaria) | 32 | 2,47% |
| HR (Croatia) | 36 | 2,41% |
| IS (Iceland) | 9 | 2,30% |
| FI (Finland) | 40 | 2,25% |
| EE (Estonia) | 8 | 2,23% |
| CZ (Czechia) | 226 | 2,21% |
| LV (Latvia) | 7 | 1,80% |
| SI (Slovenia) | 8 | 1,63% |
| ES (Spain) | 10 | 1,52% |
| CH (Switzerland) | 76 | 1,38% |
| BE (Belgium) | 62 | 1,10% |
| RO (Romania) | 7 | 0,99% |
| LU (Luxembourg) | 3 | 0,96% |
| AT (Austria) | 38 | 0,74% |
| EU (European CSIRTS) | 22 | 0,62% |
| DE (Germany) | 136 | 0,59% |
| SE (Sweden) | 17 | 0,59% |
| NO (Norway) | 9 | 0,58% |
| LT (Lithuania) | 2 | 0,56% |
| IT (Italy) | 75 | 0,45% |
| NL (Netherlands) | 36 | 0,39% |
| DK (Denmark) | 1 | 0,08% |
| CY (Cyprus) | 0 | 0,00% |
| LI (Liechtenstein) | 0 | 0,00% |
| Grand Total | 3081 | 2,25% |
How marketing cookies are divided between vendors
| Country | YouTube | Google Ads | TikTok | |
|---|---|---|---|---|
| FR | 684 | 534 | 33 | 6 |
| PL | 500 | 81 | 80 | 6 |
| HU | 211 | 40 | 12 | |
| CZ | 135 | 42 | 54 | |
| DE | 91 | 35 | 14 | 3 |
| GR | 69 | 15 | 1 | |
| CH | 53 | 10 | 17 | |
| IT | 57 | 17 | 7 | |
| BE | 34 | 19 | 12 | |
| FI | 21 | 8 | 13 | 1 |
| PT | 35 | 1 | 6 | 1 |
| AT | 31 | 6 | 2 | |
| HR | 27 | 9 | 3 | |
| NL | 22 | 4 | 14 | 2 |
| BG | 28 | 3 | 1 | |
| EU | 21 | 1 | ||
| SE | 10 | 5 | 2 | |
| ES | 7 | 3 | 2 | |
| IS | 2 | 1 | 7 | |
| NO | 5 | 1 | 4 | |
| EE | 4 | 2 | 2 | 1 |
| SI | 7 | 1 | 1 | |
| SK | 6 | 2 | 2 | |
| LV | 6 | 1 | 1 | |
| RO | 7 | |||
| MT | 4 | |||
| IE | 3 | |||
| LU | 1 | 2 | ||
| LT | 1 | 1 | ||
| DK | 1 | |||
| Grand Total | 2077 | 842 | 293 | 20 |
phpMyAdmin panels
| Country | Domain |
|---|---|
| FR | 513 |
| PL | 499 |
| HU | 368 |
| DE | 300 |
| CZ | 258 |
| IT | 232 |
| AT | 64 |
| BE | 48 |
| NL | 27 |
| CH | 20 |
| BG | 17 |
| GR | 14 |
| FI | 13 |
| HR | 8 |
| SI | 7 |
| LT | 6 |
| LV | 6 |
| EU | 5 |
| PT | 4 |
| RO | 4 |
| EE | 2 |
| IS | 2 |
| SE | 2 |
| DK | 1 |
| LU | 1 |
| SK | 1 |
| Grand Total | 2419 |
Properly encrypted e-mail
| Country | Passed test | Domains with mail | Percentage |
|---|---|---|---|
| NL | 220 | 382 | 58% |
| DK | 44 | 99 | 44% |
| PT | 21 | 275 | 8% |
| EU | 18 | 384 | 5% |
| SE | 12 | 294 | 4% |
| CZ | 104 | 5252 | 2% |
| CH | 38 | 2046 | 2% |
| BE | 10 | 576 | 2% |
| NO | 6 | 363 | 2% |
| IS | 1 | 64 | 2% |
| GR | 3 | 328 | 1% |
| DE | 102 | 12338 | 1% |
| FR | 113 | 15339 | 1% |
| HR | 1 | 427 | 0% |
| AT | 2 | 1776 | 0% |
| PL | 2 | 2596 | 0% |
| HU | 1 | 2658 | 0% |
| BG | 351 | 0% | |
| CY | 9 | 0% | |
| EE | 47 | 0% | |
| ES | 85 | 0% | |
| FI | 330 | 0% | |
| IE | 38 | 0% | |
| IT | 933 | 0% | |
| LI | 11 | 0% | |
| LT | 60 | 0% | |
| LU | 96 | 0% | |
| LV | 49 | 0% | |
| MT | 61 | 0% | |
| RO | 125 | 0% | |
| SI | 200 | 0% | |
| SK | 9 | 0% | |
| Grand Total | 698 | 47601 | 1% |