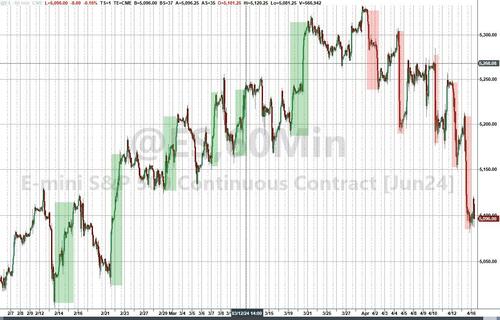
The US equity market appears to have changed regime from "buy the dip" to "sell the rip" (and reduce delta), according to Goldman Sachs flow of funds guru Scott Rubner.
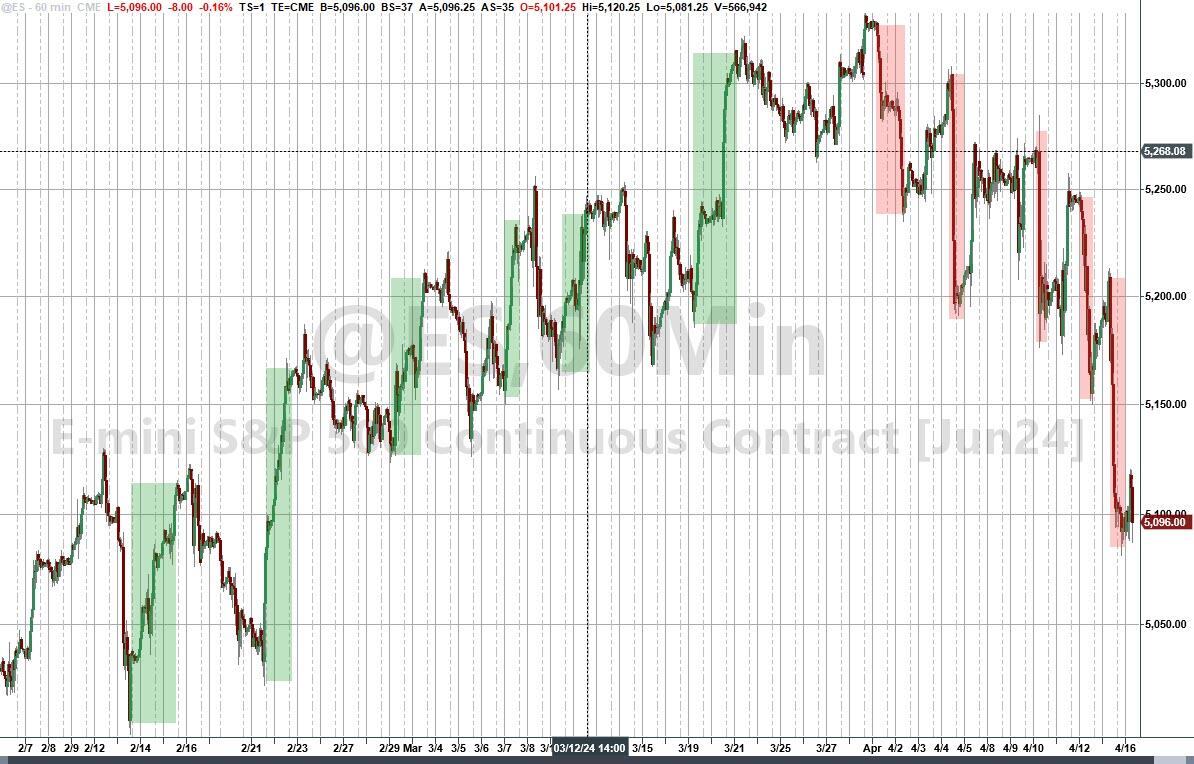
In a note this morning, he points out that he is receiving a lot of questions about so-called 'non-fundamental sellers' - a topic we have discussed extensively in the last couple of days as CTA thresholds are crossed and vol-strategy players get proper-f**ked by geopolitical upsets. and OpEx gamma unclenching.
Rubner says "there is a supply and demand mismatch right now" and has three views on where we stand:
-
View 1 - your inbox will soon be filled with bearish toned emails.
-
View 2 – the bar for earnings for highly owned companies just got a lot harder to beat given market volatility.
-
View 3 – we have seen a short term lid on the topside, as demand runs out of ammo into “sell in may and go away” which was already planned.
Here are 10 things that Goldman's flows guru is watching:
1. Challenged liquidity in macro products, as liquidity is a privilege.
At the start of the month, top book ES1 liquidity was $22M on the screens, and it is currently $8M, a drop in liquidity of -64%.
Anytime this number gets below $10M, liquidity becomes challenged when you are trying to move big risk.
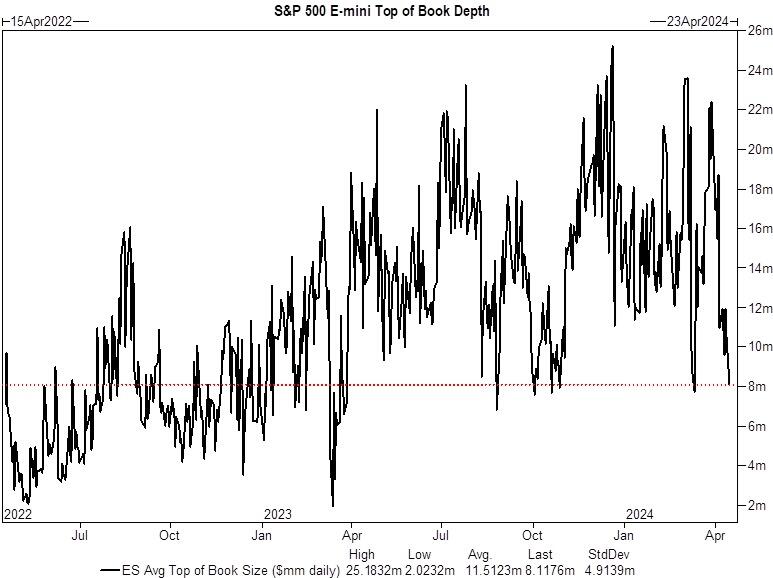
Source: Goldman Sachs
2. Index Gamma is no longer max long from vol selling programs.
There has been a drop in long index gamma of $7B since the start of the month. Index Dealers are now long only $1B.
This is the lowest long position of 2024. New...
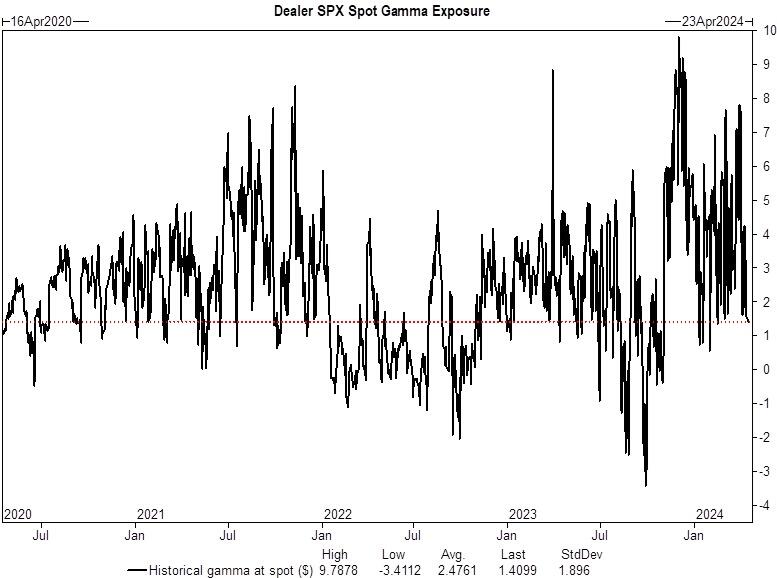
Source: Goldman Sachs
3. Institutional demand for protection, this has offset vol supply, this is new.
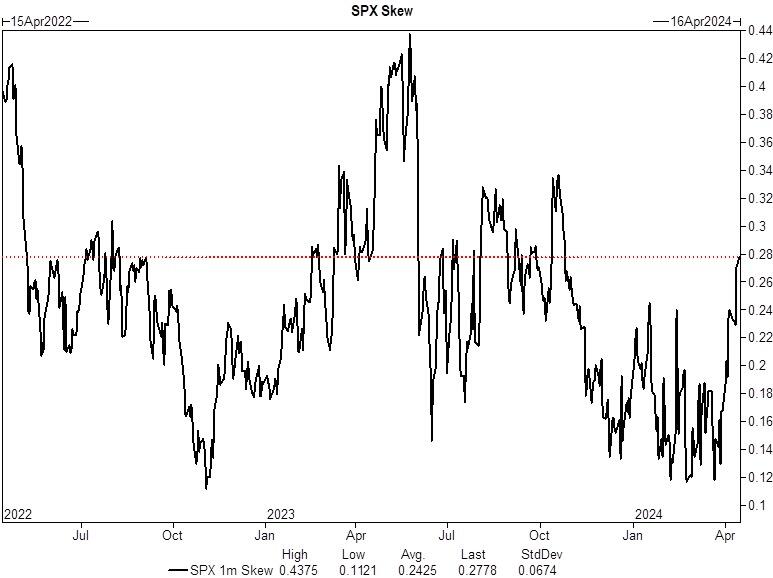
Source: Goldman Sachs
Trade Idea to take advantage of this dynamic.
1. SPX – BUY SPX December 95% put with an 82.5% Knock-out for 36bps. This is a 70% discount to the vanilla put spread. Cheapest line in the water.
2. IWM – BUY IWM December 95% put with an 82.5% Knock-out for 48bps. This is a 72% discount to the vanilla put spread. Lowest quality leads to the downside.
3. QQQ – BUY QQQ December 95% put with an 82.5% Knock-out for 38bps. This is a 77% discount to the vanilla put spread. Hedge what you got.
Max Loss: Premium paid for options purchased. Levels as of yesterdays close.
4. CTA Equity Deleveraging – CTAs are near max long.
We have S&P for sale in every one of our modelled scenarios, this is a Red Wave.
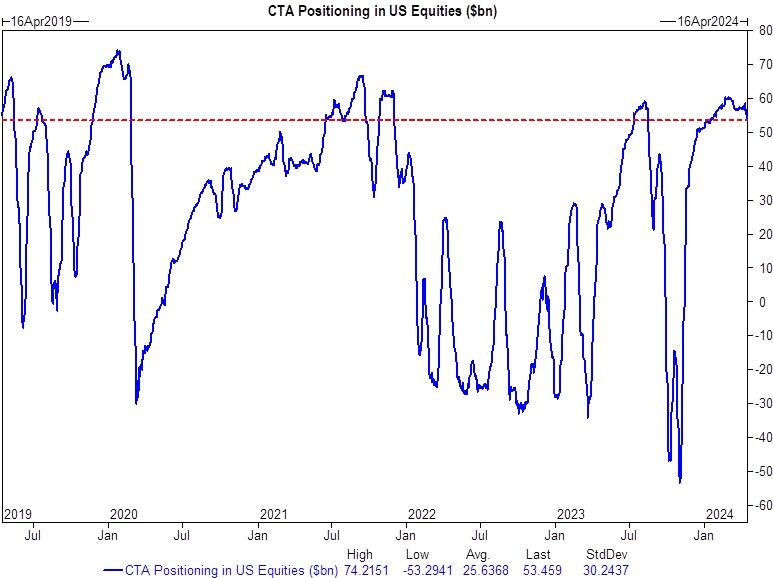
Source: Goldman Sachs
Over the next 1 week…
a. Flat tape: Sellers $4.5B ($7.5B out the US)
b. Up tape: Buyers $3.3B ($2.7B out the US)
c. Down tape: Sellers $28.9B ($14.4B out the US)
Over the next 1 month…
d. Flat tape: Sellers $19.2B ($14.4B out the US) – first large supply number.
e. Up tape: Buyers $17.2B ($1.8B into the US)
f. Down tape: Sellers $228.8B ($78.5B out the US)
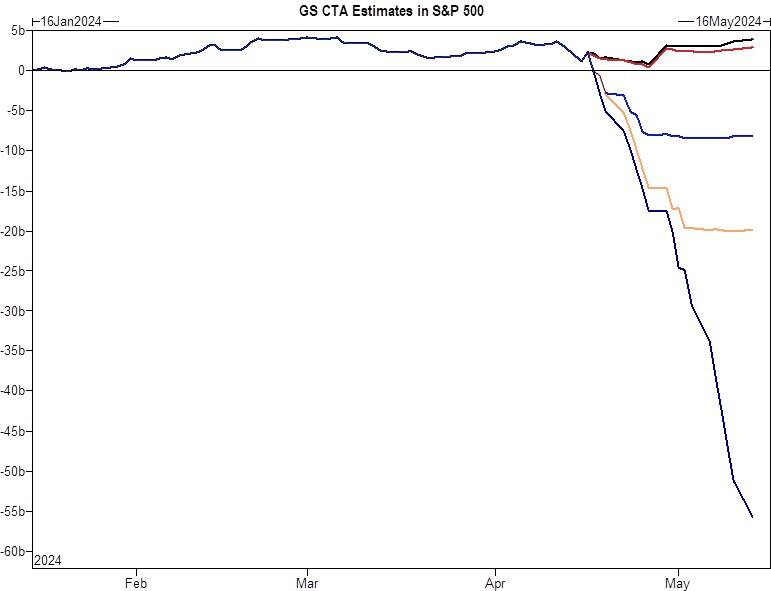
Source: Goldman Sachs
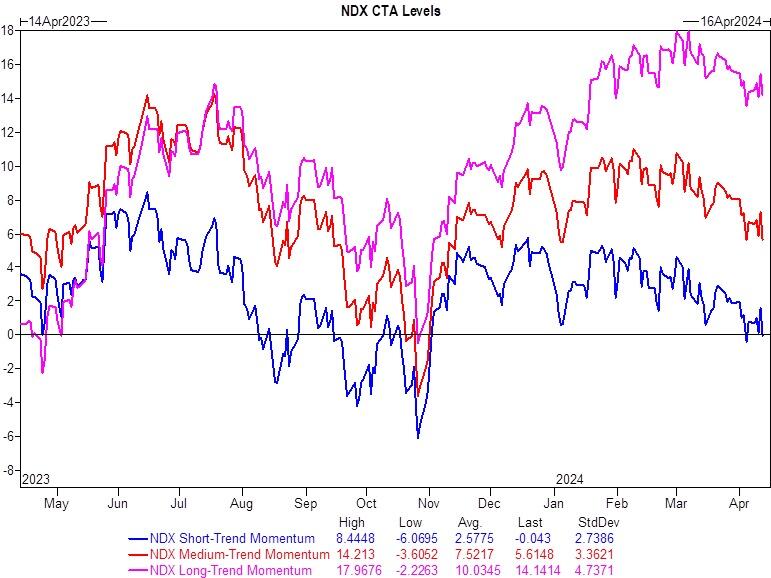
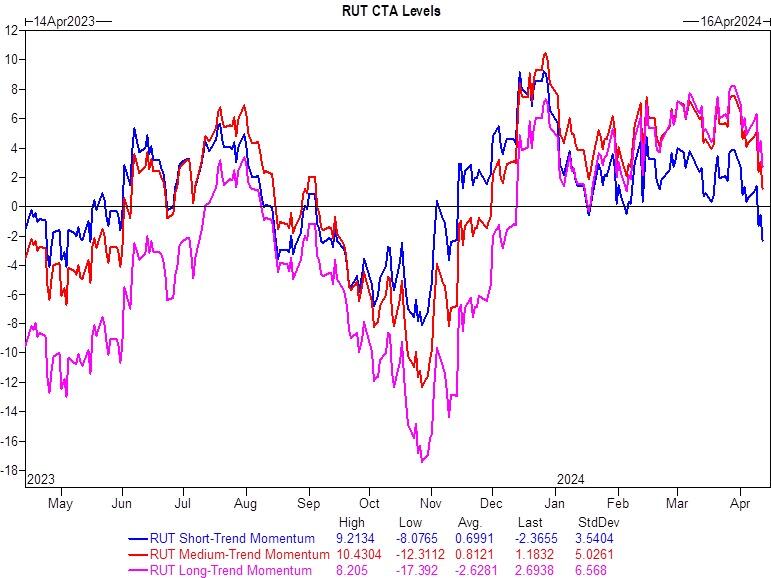
5. CTA S/T threshold levels tripped in S&P, NDX, and Russell 2k for first since November.
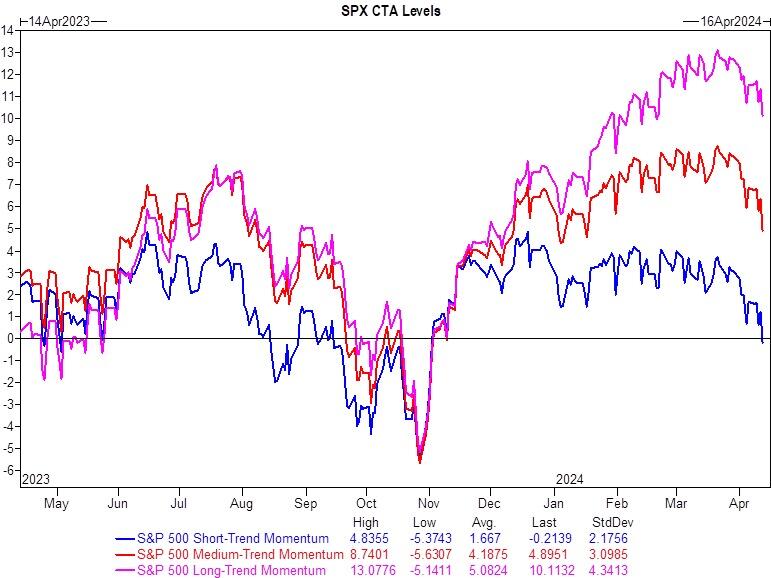
Source: Goldman Sachs
Source: Goldman Sachs
Source: Goldman Sachs
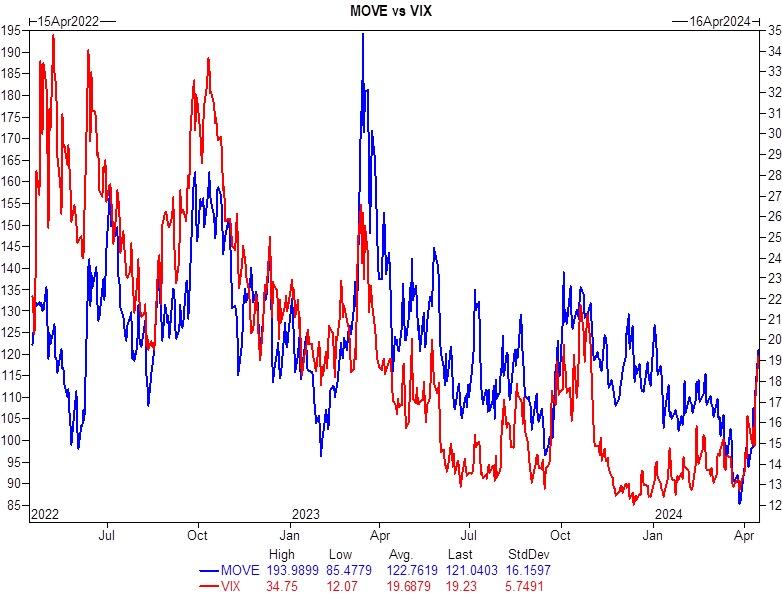
6. Volatility Control Strategies (max long) and central book desk hedging “VAR” shocks.
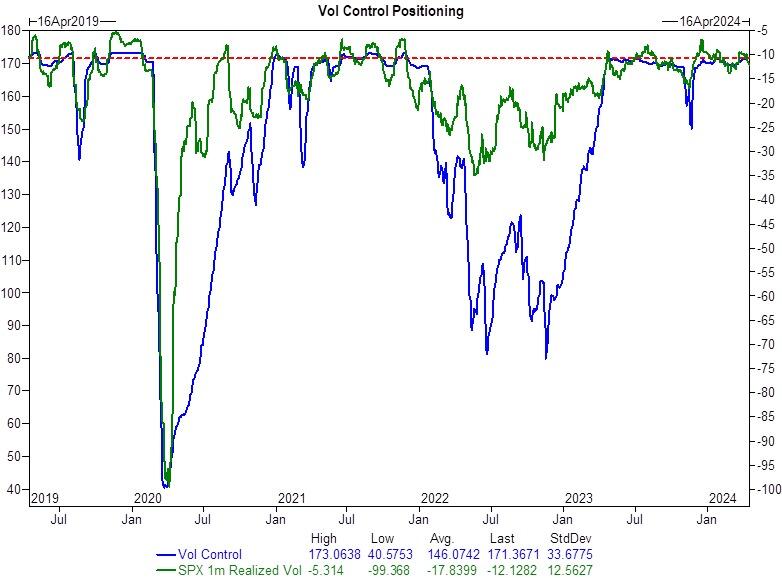
Source: Goldman Sachs
VIX settled at 19.23, the highest close on the year, and now the largest 2 day move for the VIX (4.3 handles) since March of '23. October of '23 was the last time we saw VIX north of 19.
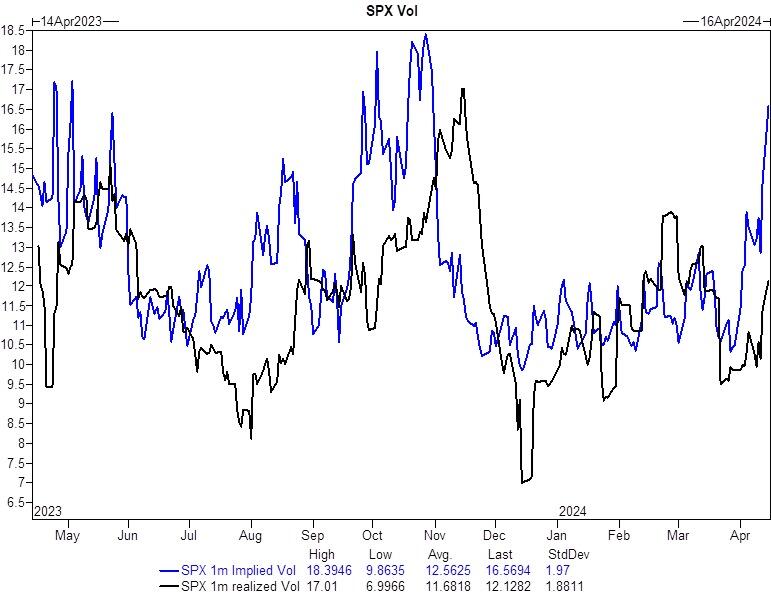
Source: Goldman Sachs
7. Risk Parity Exposure is at the highest level since late 2021. Equity and Fixed income correlation is too high.
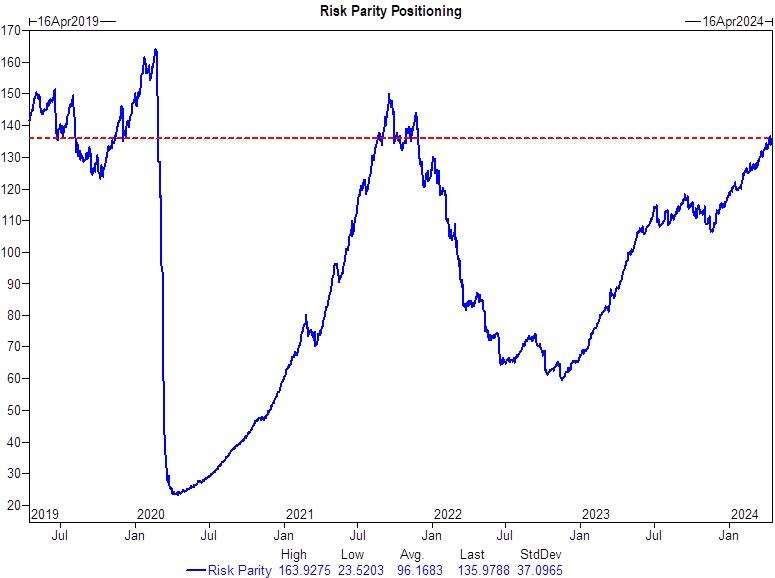
Source: Goldman Sachs
Source: Goldman Sachs
The 1 year rolling correlation between equities and fixed income ranks in the 95th percentile since 2000, which becomes a tough proposition for the US 60/40 portfolio.
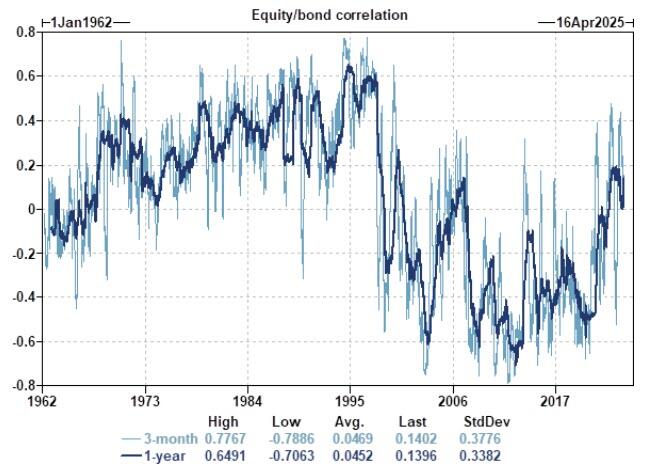
Source: Goldman Sachs
8. Funding Spreads are elevated.
Funding Spreads are coming up in conversations at GS. They are ticking at notably elevated levels given the increased demand for leverage on the long side.
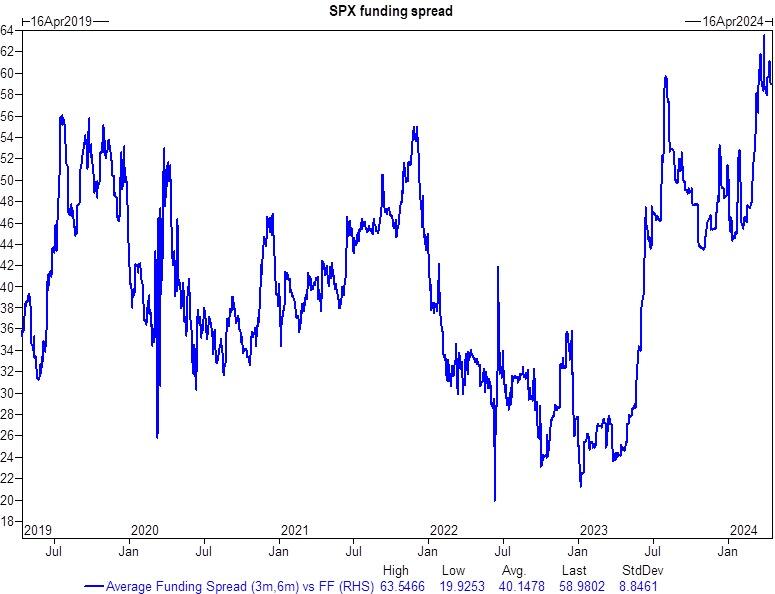
Source: Goldman Sachs
9. HF Gross Exposure elevated
1-year rank 89th, 3-year rank 96th, 5-year rank 98% .... running long the good stuff.
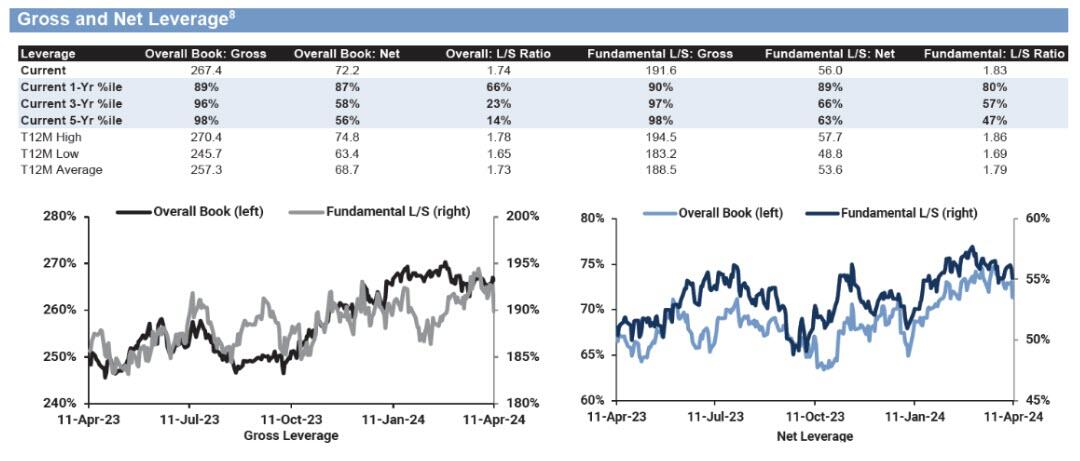
Source: Goldman Sachs
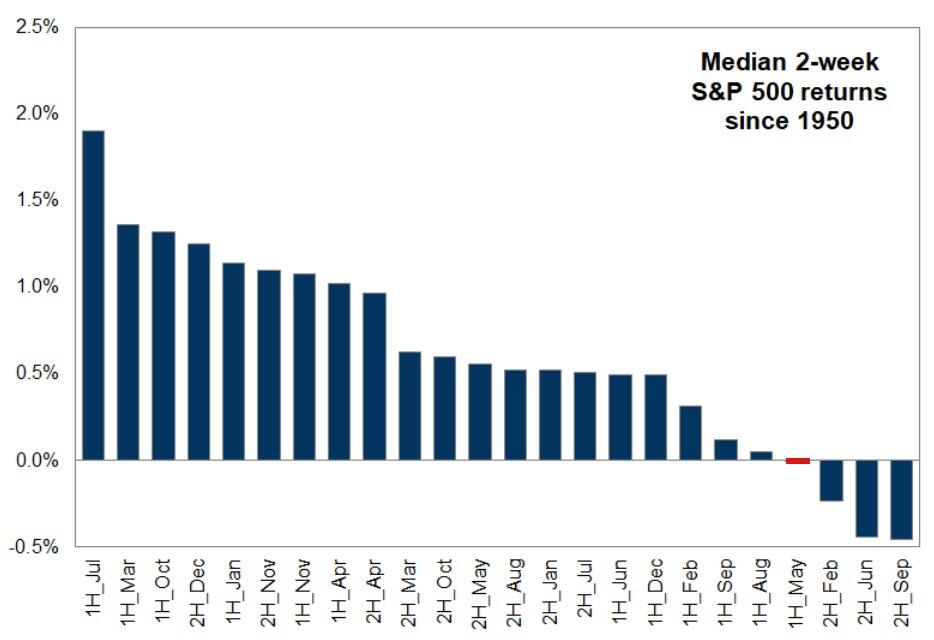
10. Seasonals
Sell in May and Go-Away, the first two weeks of may represent the 4th worst two-week period of the year.
Source: Goldman Sachs
Professional subscribers can read Rubner's full note here...