no healthy upstream is the kind of error that makes you expect wreckage.
Then you open the dashboards and find… almost nothing. CPU is low. No pods have crashed. The last deployment was hours ago. By the time you refresh the page, the service has recovered by itself.
That was the scene a few weeks ago when I started chasing an intermittent failure in a search backend. The eventual fix was only a few lines. The interesting part was getting there.
We already had a confident root-cause analysis (RCA), complete with a tidy explanation and a one-line remedy. It was also pointing at the wrong subsystem. This post is about the gap between a plausible story and the evidence, and about a common failure mode in which a mostly healthy fleet slowly removes itself from service.
The shape of the failure
The setup was ordinary: a search backend behind a load balancer, with a fixed pool of worker processes on each instance.
Every so often, with no obvious schedule, a burst of requests failed. The browser showed a bare no healthy upstream, and a minute or two later everything worked again.
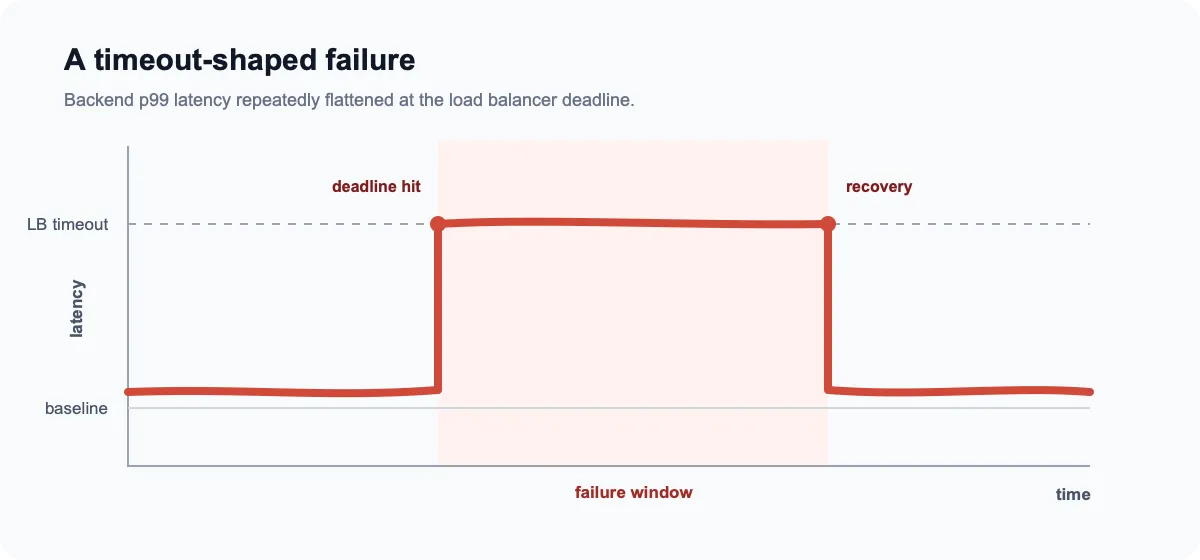
One clue appeared every time. Backend p99 latency climbed to almost exactly the load balancer timeout, stayed flat, and then dropped back to normal:

That shape matters. Organic slowdowns tend to be uneven. This was a cliff, a flat top, and a recovery. Requests were not gradually becoming slower; they were running into a deadline and being cut off.
The theory I inherited was CPU throttling. A heavy periodic job supposedly pegged the pod’s CPU, the scheduler throttled it, request handling starved, and the load balancer eventually evicted the instance.
It was coherent. Better still, it came with a one-line fix: raise the CPU limit. That is an attractive combination during an incident. But a root-cause theory makes predictions, and these predictions did not survive contact with the evidence.
Treating the RCA as a hypothesis, not a conclusion
Instead of treating the existing RCA as a conclusion, I treated it as a hypothesis: if CPU throttling caused the incidents, what else should I be able to observe?
Three checks came back wrong.
There was no CPU-bound work in the serving path. The compute-heavy batch indexers ran on separate machines and reached the datastore over the network. They never ran inside the pods serving requests. A process outside the pod’s cgroup cannot cause that pod to be CPU-throttled. The graphs agreed: container throttling counters stayed flat during every event.
The timing did not fit a scheduled trigger. The batch jobs ran on a coarse schedule and produced one sustained utilisation bump. The incidents arrived at arbitrary minutes and happened far more often than the jobs ran. If a timer were responsible, the failures should have followed the timer. They did not.
The failures ignored instance and version boundaries. The same symptom appeared across different pods and deployment SHAs. A regression usually follows a version. A shared external event usually hits the fleet together. These failures did neither. The pattern looked more like each instance was doing something to itself, triggered by its own traffic.
To keep the CPU theory alive, I would have had to explain away the topology, the timing, and the distribution of failures. At that point the theory was creating more questions than it answered, so I dropped it and went back to the logs.
One line in the logs, and why it changes the model
The event window contained one recurring error:
ConnectionTimeout: Connection timed outThe stack ended in the datastore client, blocked on a socket read that never returned.
That one line flipped the model.
A CPU-throttled worker is ready to run but cannot get enough scheduler time. A worker blocked on I/O is off-CPU, waiting on the network while still occupying its worker slot. From the outside, both look like “latency went up, then requests timed out.” Underneath, they are opposites.
Adding CPU to an I/O stall does not unblock the socket. At best, it gives you more workers to park behind the same slow dependency. This is why edge symptoms are a dangerous thing to tune against: resource saturation and dependency blocking can produce the same fever while needing completely different treatment.
Why one slow dependency saturates the whole instance
The mechanism came down to two ordinary client settings that were dangerous in combination:
- No timeout on individual datastore calls. One call could occupy a worker long after the user had given up.
- Retries on connection timeouts. After waiting too long once, the worker would wait again, with backoff in between.
Nothing exotic. That is partly what makes this failure mode easy to miss.
Little’s Law shows why it is fatal to a fixed worker pool. Concurrency is L = λW: the arrival rate (λ) multiplied by the average time each request spends in the system (W).
Suppose the service receives 200 requests per second and normally responds in 40 ms:
L = 200 req/s × 0.04 s = 8 concurrent requestsEight concurrent requests are easy for the pool to absorb. But if the datastore slows down and requests wait for tens of seconds, W increases by three orders of magnitude. Retries stretch it further. The required concurrency quickly exceeds the number of workers available.
The pool then looks something like this:

This creates head-of-line blocking. Workers parked on datastore calls cannot serve the fast requests behind them, so latency rises for everything, not only for requests that reached the slow dependency.
Health checks are caught in the same queue. They time out, the load balancer removes the instance from rotation, and the remaining instances receive more traffic. Once enough instances fail their health checks, the load balancer has nowhere to send the next request. That is when the user sees no healthy upstream.
There was one more twist. The client’s total retry time could exceed the load balancer’s deadline:

The load balancer returned an error while the worker continued retrying a result nobody could receive. Every millisecond after the outer deadline was wasted work, and the wasted work held a scarce worker slot.
This is a deadline-propagation failure. Inner operations must finish inside the outer request deadline. Better still, pass the outer deadline through the call chain so every layer knows when its result has become useless.
Why it recovered by itself
The recovery was initially reassuring. In hindsight, it was the worrying part.
The datastore blip triggered retries. Those retries added load to the datastore while it was already struggling, which caused more timeouts and therefore more retries:

That is the start of a metastable failure: a brief trigger knocks the system out of its healthy state, then a feedback loop keeps it unhealthy after the original trigger has passed.
We got lucky. The datastore blips were short enough that traffic fell below the tipping point before the retry loop became self-sustaining. A slightly longer blip could have kept the loop alive until we restarted the fleet or shed enough traffic to escape it.
Self-recovery was not proof of resilience. It was a warning shot.
The fix, and why we kept it small
The instinct during an availability incident is to add headroom: raise CPU limits, increase the worker pool, add replicas. That can help with genuine capacity problems. Here, it would only give the retry loop more workers to occupy.
The useful fix was to put a hard bound on the cost of one request.
First, add an explicit timeout to every downstream call. Choose it from the dependency’s healthy latency distribution rather than picking a pleasing round number. It should sit comfortably above healthy p99.9, but well below the load balancer’s deadline. A call that can wait forever is a worker you can lose forever.
Second, bound retries as a fraction of normal traffic, not as an unconditional count on every request. A rule such as “retry three times” allows every client to multiply traffic precisely when the dependency is least able to handle it. A token-bucket retry budget keeps the added load bounded; the Google SRE guidance uses 10% as an example. Add jitter too, or clients can wake up and retry in synchronised waves.
Third, be especially reluctant to retry connection timeouts. During saturation, a timeout often means the dependency is already over its limit. Another immediate attempt is unlikely to help. Retries make the most sense for independent, transient failures and only for idempotent operations. Search requests were idempotent, at least, so duplicate side effects were not another problem waiting for us.
The decision for each failed call becomes straightforward:

Circuit breakers, load shedding, and bulkheads could all strengthen this design:
- A circuit breaker stops callers repeatedly rediscovering the same outage.
- Load shedding rejects excess work early enough to keep the service responsive.
- A bulkhead gives the dependency its own bounded concurrency pool, preventing it from occupying every worker.
All three add code, tuning, and operational state. We did not have evidence that we needed them yet. Once a small timeout and a bounded retry policy removed the amplifier, adding more machinery would have solved a hypothetical problem rather than the incident in front of us.
“Won’t failing fast just move the errors to the caller?”
This was the immediate pushback: if the backend gives up sooner, won’t users simply see more errors?
Only if we compare failing fast with a world in which every request eventually succeeds. That was not the world we had.
With the worker pool full of hung calls, every request eventually failed. The entire search feature became a no healthy upstream page, including requests that never needed the slow dependency in the first place.
Failing fast keeps the instances responsive and in rotation. It turns one correlated, fleet-wide outage into a smaller number of independent failures: the requests that actually hit the bad path. Those are failures a caller can absorb with a cached result, an empty state, or a retry button.
A nonessential component should not be able to take down the whole page. Give it its own deadline and a graceful fallback, and a slow dependency degrades one part of the experience instead of replacing the entire document with an error page.
Verifying the bound, not asserting it
I did not want to ship a fix that worked only on a whiteboard, so the validation was intentionally mechanical.
With a healthy dependency, normal traffic should remain normal: the same latency distribution and no new errors. If the timeout clips healthy p99.9 requests, it is too aggressive and will create the very failures it is meant to prevent.
With an unreachable dependency, requests should fail near the configured bound and before the outer load balancer deadline. More importantly, worker occupancy and in-flight request counts should remain flat instead of climbing.
That flat line under induced failure is the real acceptance test. It shows that the amplifier is gone.
The saturating case needs its own load test. The happy path will never prove that a service behaves well when every downstream call is stuck.
What I actually took from it
The technical lesson is easy to audit for: an unbounded downstream call plus eager retries is a latent outage with a feedback loop attached. It can sit quietly for months, green on every dashboard, until a dependency has a bad thirty seconds. Then it turns that blip into a fleet-wide event.
It is worth searching your own services for downstream calls without deadlines and retries without a shared budget. Those two settings deserve to be reviewed together, because together they can change the shape of a failure.
The lesson that stayed with me, though, was about diagnosis.
The CPU theory was clean. It was mechanistic. It came with a satisfying one-line fix. And it survived three pieces of contradictory evidence because we had started treating it as an answer instead of a claim.
A useful root cause makes predictions you can check. When the topology, timing, and distribution of failures all disagree with the story, elegance stops counting. In this case, one dull line in a log file told us more than the tidy explanation we had already grown attached to.
That was the expensive part of the incident: not the eventual three-line fix, but learning to let the evidence ruin a good story.
Thanks for reading ✌️
References
- Metastable Failures in Distributed Systems - Bronson et al., HotOS ‘21
- Timeouts, retries, and backoff with jitter - Amazon Builders’ Library
- Addressing Cascading Failures - Google SRE Book
- Handling Overload - Google SRE Book
- The Tail at Scale - Dean & Barroso, CACM 2013
- no healthy upstream - Envoy load balancing FAQ
- Circuit Breaker - Martin Fowler