Meta Muse is Meta’s personal AI agent, launched on September 8, 2026. Rather than only answering questions, it is designed to carry out tasks on a user’s behalf: it has its own browser, can keep working after the app is closed, and runs in a dedicated Muse Secure VM. In presentation it resembles Grok Bot — a personified agent controlled through conversation — but that is an interface-level analogy, not an assumption of shared architecture. This article goes one layer lower and examines a narrow part of the runtime: subagent fan-out, the durable state it leaves behind, and the spawn path under load.
I ran these tests in my own Muse session, using only interfaces exposed to that session: subagent.spawn, a shell in the assigned environment, and a bounded read-only interface to durable diagnostic and trace data. I did not attempt to access other users, tenants, or data outside the environment assigned to me, and I did not bypass access controls. I am not presenting this as a Meta-authorized security assessment, and access alone is not evidence that every load experiment was separately authorized. This is a black-box/reverse-engineering write-up from the perspective of the access granted to my session.
Post-publication update — September 13, 2026. I clarified the access scope, added independent architectural context from Rohan Adwankar’s analysis, separated STAGGERED-80 from the burst-style runs, and described two controls that would better isolate cadence, topology, and concurrency. The experimental data, published CSVs, and figures were not changed.
At 06:45:32 UTC I asked a chat session to spawn 120 subagents at once. Each one had a deliberately trivial job: run sleep 30 in a shell and report a single line back.
Thirty-three of those calls created an agent. Eighty-seven failed with the same database error. The aggregated answer never arrived, and the interface eventually showed an Error state. In the durable trace, every one of the 33 created agents reached a terminal completed record - 32 of them with a confirmed workload completion, and one still unresolved - while the record of the parent still said running.
What follows is a black-box investigation of that gap, built entirely from records the runtime wrote to PostgreSQL as it worked: an agent registry, a spawn ledger, per-worker progress tables and a context-item store. The load tests were not re-run to write this article. Everything here was reconstructed from stored state, with one documented exception I will come back to.
What Muse looked like from the outside
From a user’s seat this was an ordinary chat session. The persona text was plain; the tool list was not.
Among the tools the session could call were subagent.spawn, subagent.close and subagent.resume, plus a read-only interface to a PostgreSQL database. That database was not incidental - it held the runtime’s own bookkeeping. Tables such as agent.agents, agent.subagent_spawns and agent.subagent_progress_tool_events recorded which agents existed, who spawned them, which tools they ran and when they finished.
That is how the multi-agent structure became visible at all. Not through the interface, which presented one conversation, but through the records the runtime kept for itself.
Two labels need care before anything else in this article.
The first is the model string. Every agent row I read - the root, the coordinator, all 33 workers of the largest burst - carried the same value:
ipnext/avocado-5.16-v4That string is observed. What it means is not. It could be an internal model build, a routing alias, or something else entirely; the trace does not say, and I am not going to guess. I am publishing it verbatim because it is one of the few hard identifiers the durable trace provides.
The second is the runtime’s description of itself: Muse Spark 1.3, from Meta’s Muse family. That comes from the runtime’s own context rather than the trace, so it is self-reported, not verified. Everything else in this article is anchored in records.
Independent architectural context
After publication I found an independent teardown of a contemporary Muse instance by Rohan Adwankar. In his environment, PostgreSQL ran inside the per-user VM over a local Unix socket, and the harness binary contained both avocado-5.16-v4 and ipnext/... paths. That fits several of my observations and gives them useful architectural context, but it does not change the boundary of the evidence: my data still does not identify the specific lock, table, row, index, query, or transaction responsible for the timeouts.
I still treat ipnext/avocado-5.16-v4 as an observed model identifier. Adwankar interprets ipnext as Meta’s internal transport/gateway and avocado as an internal model family; directly mapping avocado to Muse Spark 1.3 remains an inference, not something established by my trace. Likewise, my own probe established KVM visibility, while Adwankar identified Cloud Hypervisor running on KVM in his instance. I did not independently establish the specific VMM used by mine.
External source: Rohan Adwankar, “What’s in a Muse?”
Method: counting overlapping agents
The experiments used one workload, four configurations and no retries. Three of them - PROBE-40, BURST-80 and BURST-120 - were burst-style runs issued from the root agent: every attempt in a configuration went out in a single turn. The fourth, STAGGERED-80, was deliberately spread over time and used a coordinator agent to spawn its workers. No failed call was repeated.
Concurrency here has a narrow, deliberate definition. An agent counts as active from its first tool call until its terminal record:
active(t) := first_tool_at <= t < finished_atConcurrency over time is a sweep line over those intervals, with ends processed before starts when timestamps tie. The timestamps have one-second resolution, so the sweep is deterministic for the recorded data but cannot recover event ordering within the same second.
Three consequences apply to every number below:
- This measures agent activity, not inference. Thirty-three overlapping activity windows are not thirty-three simultaneous model calls. Nothing here measures the inference backend.
- A peak is an observation, not a limit. The tests never exceeded 120 simultaneous attempts, so they cannot establish a concurrency cap - or rule one out.
- A missing record is evidence. Failed spawn calls leave nothing behind in the agent registry. That asymmetry shaped how failures had to be verified, and it is why the failure counts were the hardest numbers to pin down.
The first probe: 40 calls
The first experiment was a calibration run: 40 spawn calls issued at 06:10:36 UTC.
It created 39 agents, admitted within two seconds of each other. One call failed, and that failure is worth a closer look, because it was recovered from the durable tool trace rather than taken from the chat: the call went out at 06:10:44 UTC, the error came back at 06:10:56 UTC, and no child agent was created.
The peak observed concurrency was 39. That figure is an archival recomputation from the session’s trace table, not a live measurement, and the published summary says so.
One more detail from that reconstruction carries weaker provenance than anything else in this section. In the session-built table, eleven of the thirty-nine created agents finished with a background-processing status message instead of the requested DONE line. Because it survives only in a hand-built table, I report it with that caveat and draw no conclusions from it - except that “terminal status” and “the workload finished” are not the same statement. That distinction matters much more later.
Eighty at once, and eighty spread out
The next two experiments look like a clean A/B test. They are not.
Burst-style runs
| Configuration | Attempts | Created | Failed | Failure rate | Peak observed concurrency |
|---|---|---|---|---|---|
| PROBE-40 (burst) | 40 | 39 | 1 | 2.5% | 39 |
| BURST-80 (burst) | 80 | 75 | 5 | 6.25% | 72 |
| BURST-120 (burst) | 120 | 33 | 87 | 72.5% | 33 |
STAGGERED-80 — separate configuration
I show STAGGERED-80 separately because this run changed both cadence and topology. Its 0% failure rate is therefore not a fourth point in the same series as 2.5%, 6.25%, and 72.5%.
| Configuration | Attempts | Created | Failed | Failure rate | Peak observed concurrency |
|---|---|---|---|---|---|
| STAGGERED-80 (spread) | 80 | 80 | 0 | 0% | 38 |
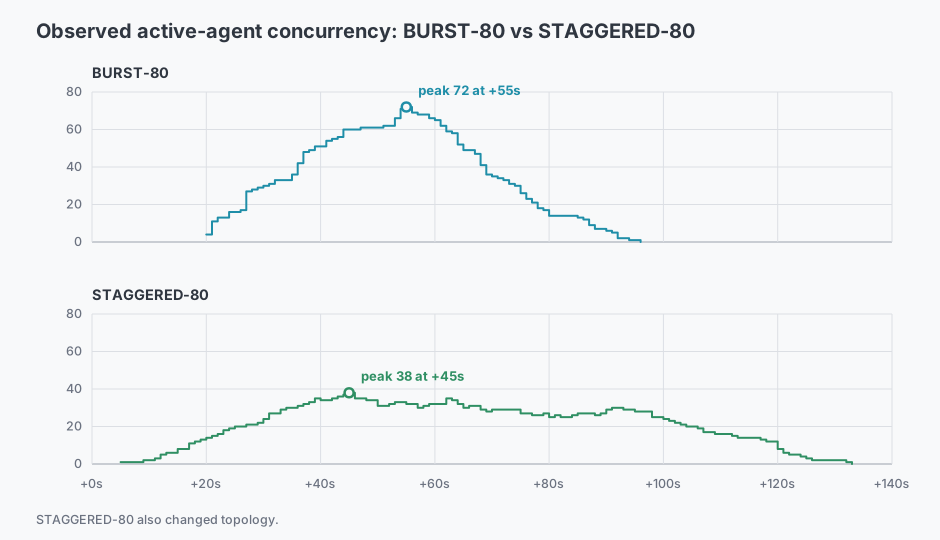
BURST-80 issued 80 spawn calls at once, at 06:30:43 UTC. Seventy-five agents were created - all of them direct children of the root agent - and five calls failed. All five returned the identical database lock timeout, each about 58 seconds after the call was placed. The peak observed concurrency was 72, recomputed after the run from the analysis input for that phase.
STAGGERED-80 started at 06:32:03 UTC and issued the same number of calls, spread out. It created all 80, with zero failures. It is also the experiment that refuses to be a clean control, because two things changed at once. First the cadence: the intended spacing was 100-200 milliseconds, but the measured mean admission gap was 1.1266 seconds, roughly ten times wider than planned. Then the topology: the root spawned one coordinator at depth 1, and the coordinator spawned the 80 workers at depth 2. The burst experiments spawned workers directly from the root.
The staggered run also peaked lower - 38 active workers against 72 in the comparable burst - so the two runs differ on more than their failure counts.

first_tool_at <= t < finished_at, with finishes processed before starts on timestamp ties; timestamps have one-second resolution. Each configuration was run once. STAGGERED-80 also changed topology, so this is not a cadence-only comparison; the curves show agent activity, not inference concurrency.
Source: BURST-80 aggregate reconstructed from the complete archived trace; STAGGERED-80 independently recomputable from the published worker rows.

The cliff between 80 and 120
The fourth experiment is where the failure rate stops being a curiosity.
At 06:45:32 UTC the root agent issued 120 spawn calls in one turn. The experiment wrote its own ledger for that turn, and it is complete:
- 33 created (27.5%), every one a direct child of the root, every admission recorded in the same second: 06:46:01 UTC, twenty-nine seconds after the burst was issued.
- 87 failed (72.5%), all with the database lock timeout, none retried.
Across the three burst runs the observed failure rates were 2.5%, 6.25% and 72.5% - one run per configuration. The staggered run’s 0% does not belong in that comparison, because it also changed topology. The largest step came between 80 and 120 attempts, and that is about all the data says: a suggestive difference, not a rate law.

The peak observed concurrency in this run was 33, at 06:46:24 UTC. The runtime was not asked for 33 workers; it was asked for 120. What the trace shows is 33 workers with activity intervals and 87 attempts recorded as spawn failures. Their call-to-error latencies were not captured, so it does not show when those failures came back relative to the admissions.
Observed: both peaks are recomputable from the published rows. A sweep line over the 33 BURST-120 intervals gives 33 at 06:46:24 UTC, and the same procedure over the 80 staggered rows gives 38 at 06:32:48 UTC. Neither is a cap; both are single observations.

Even the calls that succeeded were slow to become workers. Measured from the moment the burst was issued, the median created worker reached its first tool call after roughly 36.5 seconds; measured from its admission, the median was about 7.5 seconds. The trace establishes when the admissions were recorded and when each worker first called a tool - it does not decompose the interval between those two points, so nothing here should be read as a statement about what the runtime was doing during it.
Counting failures in this system has a structural problem: a failed spawn creates no child-agent row and no spawn-ledger row. The failure itself is not lost - it survives in the durable tool trace, as the stored call and its output - but you have to know where to look. The archive of this session was frozen before that pass was done. Six failed calls were recovered later from context items, which is also why the experiment needed its own ledger to count the rest:
| Attempt | Spawn call (UTC) | Error result (UTC) | Call → error |
|---|---|---|---|
| PROBE-40 #19 | 06:10:44 | 06:10:56 | 12 s |
| BURST-80 A-67 | 06:31:00 | 06:31:58 | ~58 s |
| BURST-80 A-69 | 06:31:00 | 06:31:58 | ~58 s |
| BURST-80 A-70 | 06:31:00 | 06:31:58 | ~58 s |
| BURST-80 A-73 | 06:31:00 | 06:31:58 | ~58 s |
| BURST-80 A-74 | 06:31:00 | 06:31:58 | ~58 s |
All six returned the same payload, character for character:
{"error_code":"spawn_failed","error_message":"database error: sqlx error: error returned from database: canceling statement due to lock timeout"}And for all six, the negative checks agree: no child-agent row, no spawn-ledger row, no child agent. Each call failed on a database operation with a lock timeout before any of those rows appeared. Which SQL operation was involved is not known from this data.
Twelve seconds, fifty-eight seconds, and what they do not mean
Both latencies in that table - 12 seconds for the probe failure, about 58 seconds for the five burst failures - are elapsed time between two events on the call path: the call going out, and the error coming back. They are not a measurement of how long those calls waited on a lock, and they do not tell us the configured timeout value.
A timeout value is a configuration fact. The trace records elapsed time between two events. Those are different things, and the difference matters, because this is exactly the kind of gap where a confident-sounding number turns into a wrong architectural claim.
Unknown: whether that duration is fixed, whether the call is retried anywhere else, and whether the calls spent the whole interval waiting on one lock. The latency of the 87 failures in the 120-attempt burst was never captured at all - that ledger records outcomes and error classes only.
Where the evidence points
The failure evidence points toward one place: the path that writes a spawn. The failures happen on subagent.spawn, they carry a PostgreSQL lock timeout from the database layer, they create nothing, and they appear in two separate burst runs with an identical fingerprint. The workers that do get created run their trivial workload without incident: 32 of the 33 were confirmed to have run the full 30-second sleep, with activity windows of 32 to 43 seconds.
That is a coherent picture, and it supports a specific hypothesis.
Two unknowns sit around that hypothesis, and both are easy to gloss over:
- Admission policy. The trace shows 33 admissions in the same second and 87 timeouts. It records nothing about ordering, queueing or admission logic. The data cannot distinguish “rejected after a wait” from “queued internally and then dropped”, and it cannot tell you which call was served before which.
- Failure latency for the big burst. The 87 failures were logged as outcomes, not as timed events. Only the six recovered failures have timestamps on both ends.
The answer that never arrived
The failure that matters most to a user is not a timeout. It is what the session looked like afterwards.
After the 120-attempt burst, the durable state was unambiguous about the workers and strange about the parent:
| Record | Durable state |
|---|---|
| 33 created workers | terminal status completed |
| 32 of those workers | durable DONE final response, workload confirmed |
| 1 worker (C-85) | terminal status completed, workload outcome unrecoverable |
| Root agent | status running, no recovery-owner row, no failure record |
| Session interface | Error state |
The final aggregation never reached the user. The last worker finished at 06:46:56 UTC. When the root row was read during the recovery pass, its updated_at was 07:00:59 UTC and its status was still running; the interface showed Error around that time. That interface state is a presentation-layer observation with no corresponding record in the trace.
What the trace supports is narrower - and more useful - than the story it invites: durable worker results can exist independently of the parent delivering an aggregated answer. That is a statement about records, not about survival. No parent agent was ever failed on purpose during these experiments, and nothing in the trace records a parent failure while workers were running. Whether children outlive a parent failure was not tested and is not known.
The report that got ahead of the trace
One smaller incident belongs on the record, because it is the same mistake in miniature.
The first generated version of the 120-attempt report asserted that the parent had failed while its workers kept running. The trace did not support that. The draft was produced at 07:05:54 UTC; a corrected HTML report followed at 07:13 UTC, built on the durable record instead - root running, no failure entry, last worker finished about thirteen minutes before the Error state appeared. The rendered PDF was then synchronised with the corrected conclusion in two edit rounds, and the consistency audits passed.
What produced the bad first draft is unknown. A plausible reading is that an asynchronously generated artifact worked from an earlier snapshot of the reasoning than the chat did. That is a hypothesis about tooling, not a finding about the runtime - but the operational lesson is concrete: for asynchronously generated artifacts, the canonical source has to be declared, and cross-artifact audits are not optional.
Silence is not a hang
One more observation, because it cost nothing and taught something.
An artifact update was requested at 07:28:29 UTC. For the next thirty-two minutes the interface showed no fresh progress events at all. At 08:00:48 UTC the task completed successfully, without being prompted or restarted.
Progress events are a weak liveness signal. Their absence is not evidence that a task is stuck, and acting on that absence - killing the work and re-issuing it - would have thrown away a task that was going to finish. Why the builder went quiet for half an hour is unknown from durable data.
The environment snapshot is the least glamorous part of this evidence, and one of the more useful parts if you want to reason about where the work actually ran.
| Fact | Value |
|---|---|
| OS | Ubuntu 24.04.5 LTS, x86_64 |
| CPU | 2 vCPU (AMD EPYC 9D25) |
| Memory | 7.7 GiB total |
| Virtualisation signals | KVM hypervisor visible, systemd-nspawn detected, home filesystem on Btrfs through an overlay |
| GPU | No NVIDIA tooling or device visible |
| Tooling | Python 3.12.3 present, no PostgreSQL client installed |
The container-in-a-VM reading - KVM above, systemd-nspawn around, overlay on Btrfs - is an interpretation of those signals, and it describes the sandbox where tool calls ran. It says nothing about where inference happens. Whether the model was served on the same host, in the same cluster, or somewhere else entirely is unknown; nothing in this data connects the sandbox to the serving path.
What this does and does not establish
Supported by the evidence
- A consumer-facing chat session ran a multi-agent runtime with a durable PostgreSQL trace, an explicit parent/child registry, and depth-1 and depth-2 delegation in use.
- In the burst runs, the observed spawn-failure rates were 2.5% at 40 attempts, 6.25% at 80 attempts and 72.5% at 120 attempts - one run per configuration, reported descriptively rather than as a rate law.
- Six failures were recovered from the durable tool trace; all six are the same failure type, and all six created nothing.
- Contention on the PostgreSQL spawn write path is a strongly supported hypothesis.
- Durable worker results can exist even when the final aggregated answer never reaches the user.
- Absence of UI progress events is not proof of a hang.
Not established by this evidence
- Which lock, table, row, index, query or transaction was contended.
- The configured lock timeout, or why the two observed failure latencies differ.
- Any scheduler or admission limit; the peaks (39, 72, 38, 33) are single observations, not measurements of a cap.
- The real parallelism of the inference backend. Overlapping agent activity is not overlapping model calls.
- The admission policy, the ordering, or whether any internal queueing was involved.
- Whether a child agent survives a parent failure - that experiment was never run.
- Whether depth 3 is allowed, whether subagents can be given a different model, or what
ipnext/avocado-5.16-v4denotes.
What the next controlled run would need to resolve
These data do not separate cadence, topology, and peak concurrency cleanly, because STAGGERED-80 changed the first two at the same time and also reached a lower observed peak. Two simple controls would discriminate between those explanations much better.
The first would preserve the root → worker topology and burst-style admission while imposing a hard cap of roughly 38 concurrently active workers. The second would preserve staggered admission but spawn workers directly from the root, without the intermediate coordinator. The first would help separate peak concurrency from burst admission itself; the second would separate cadence from topology.
I did not run either control. I am listing them as a replication design and a way to isolate the variables, not as missing results from this study.
Every configuration was run once. These are single observations of one session on one afternoon, not a performance characterisation of a platform.
What I would take away if I built agent control planes
- Look at the control plane first, but do not stop there. The load-related failures happened on the admission path: 87 attempts never became agents, while the workers that did exist ran their trivial workload. The end of the run failed differently - the final aggregation never reached the user, and C-85’s outcome is still unresolved.
- Durable records beat status flags. The interface said Error, the parent said
running, the workers saidcompleted. Only the trace could be interrogated afterwards. - Keep negative results. A failed spawn leaves no child-agent and no spawn-ledger row; the only durable trace of it is the tool call and its output. Without a ledger of its own, the experiment could not have counted the 87.
- Terminal status is not semantic success. C-85 is the counter-example.
- Log latencies for failures, not just outcomes. Six failures have call-to-error timings; eighty-seven have none. That asymmetry limits what can be said about the largest failure event of the session.
- Progress events are a hint, not a heartbeat. Thirty-two minutes of silence ended in a successful artifact build.
- Declare the canonical artifact. An asynchronously generated report can carry a conclusion that later reasoning has already abandoned.
- Test the failure modes you intend to claim. Parent-failure survivability is the obvious story here, and it is precisely the one this data cannot support.
None of that requires access to a model’s internals. It requires a runtime that writes down what it did.
Limitations, and where the numbers come from
Everything below is published at /evidence/meta-muse-black-box-testing/ - the CSVs, the figures, and the script that redraws them from the data:
| Dataset | What it supports |
|---|---|
experiments-summary.csv |
Counts, failure rates, peaks, admission windows, provenance per configuration |
burst-120-spawn-ledger.csv |
The complete 120-attempt ledger: 33 created, 87 failed |
burst-120-worker-timings.csv |
Per-worker first-tool and finish times behind the 33-worker peak |
staggered-80-worker-activity.csv |
The 80 staggered worker rows behind the 38-worker peak and the 1.1266 s cadence |
spawn-failures-verified.csv |
The six recovered failures, their payload, their negative child checks and their latencies |
Agent identifiers were removed from all of these files. What is published is timing, status, error class and error text.
Three limitations belong to every claim above:
- No replication. One run per configuration, no repeats, no intermediate attempt counts.
- Archival provenance where it applies. The peaks for the 40-attempt and 80-attempt bursts were recomputed after the fact from the session’s trace table; the peaks for the 120-attempt burst and the staggered run are independently recomputable from the published rows.
- One deliberate omission. I do not publish the raw per-worker rows for BURST-80 because the archived trace contains shortened agent identifiers covered by the publication policy. The archived trace itself is complete: it contains all 75 created workers, and the same sweep recomputes the canonical peak of 72 at 06:31:38 UTC. BURST-80 therefore remains aggregate in the public release.
The interesting result here is not that a system fell over at some number. It is that it fell over in a way that left a legible trail - specific enough to rule out most of the stories one would want to tell about it. That trail is published with this article, so the parts I got wrong can be checked too.