Graphviz is renowned for converting text scripts into visual diagrams, but many developers are unaware that its true rendering power relies on its specialized layout engines. Selecting the wrong layout engine can result in cluttered node overlaps, crossing lines, and unreadable architecture maps. By combining a modern diagram-as-code platform with an understanding of engine algorithms, software architects can instantly switch between hierarchical trees, radial networks, and circular rings. Testing layout options inside an interactive browser-based Graphviz editor allows engineers to choose the ideal visual representation for any dataset.
In this guide, we will compare the core Graphviz layout engines—dot, neato, twopi, and circo—explain their underlying algorithms, and show how a unified diagram-as-code platform maximizes diagram clarity.
Comparing Graphviz Layout Engines
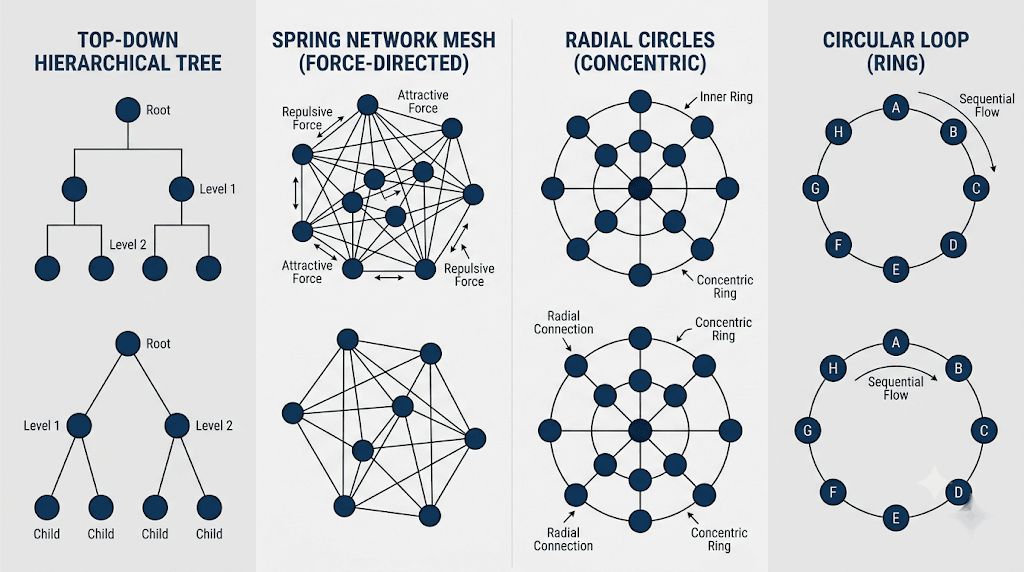
Each Graphviz layout algorithm is designed for a specific data structure. Understanding these core differences ensures your diagrams remain clean, balanced, and easy to interpret:
- Dot (Hierarchical Directed Graphs): The default engine for directed acyclic graphs (DAGs). It renders nodes in distinct ranks from top to bottom or left to right, making it ideal for software architecture, decision trees, and state machines.
- Neato (Spring-Model / Energy Minimization): Uses force-directed algorithms to position nodes based on physical spring models. Perfect for undirected networks, social graphs, and mesh topographies.
- Twopi (Radial Layouts): Arranges nodes in concentric circles based on their distance from a designated root node. Excellent for visualizing network hops, file system trees, and radial hierarchies.
- Circo (Circular Layouts): Positions clusters and interconnected nodes in circular ring structures. Best suited for ring topologies, cyclic dependencies, and recurring workflow loops.
Utilizing a feature-rich diagram-as-code platform lets you adjust the engine attribute in code to preview different structural perspectives instantly.
Visualizing Engine Layout Differences Step-by-Step
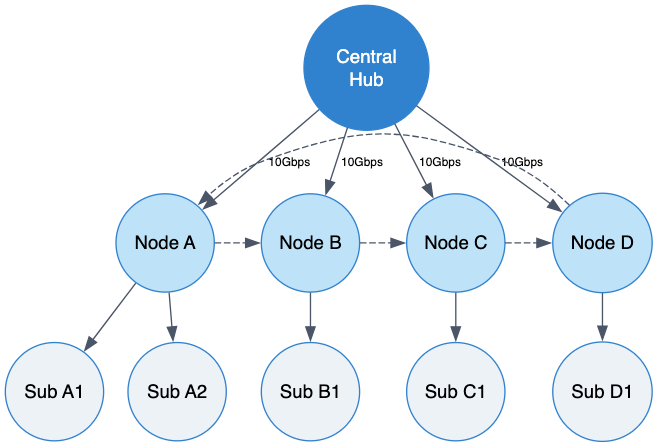
To demonstrate how different layout engines transform node relationships, let’s look at a comparative network graph script. Below is a practical code example you can copy and paste directly into your browser-based Graphviz editor:
Layout Engine Code Example (Try it Now):
digraph LayoutEngineComparison {
    // Global layout settings - change engine attribute to test dot, neato, twopi, or circo
    layout=dot;
    rankdir=TB;
    overlap=false;
    splines=true;

    node [shape=circle, style="filled", fillcolor="#ebf8ff", color="#3182ce", fontname="Helvetica", width=0.8];
    edge [color="#4a5568", fontname="Helvetica", fontsize=9];

    // Central Core Node
    Core [label="Central\nHub", fillcolor="#3182ce", fontcolor="#ffffff"];

    // First Tier Cluster
    NodeA [label="Node A", fillcolor="#bee3f8"];
    NodeB [label="Node B", fillcolor="#bee3f8"];
    NodeC [label="Node C", fillcolor="#bee3f8"];
    NodeD [label="Node D", fillcolor="#bee3f8"];

    // Second Tier Outer Nodes
    SubA1 [label="Sub A1", fillcolor="#edf2f7"];
    SubA2 [label="Sub A2", fillcolor="#edf2f7"];
    SubB1 [label="Sub B1", fillcolor="#edf2f7"];
    SubC1 [label="Sub C1", fillcolor="#edf2f7"];
    SubD1 [label="Sub D1", fillcolor="#edf2f7"];

    // Hub Connections
    Core -> NodeA [label="10Gbps"];
    Core -> NodeB [label="10Gbps"];
    Core -> NodeC [label="10Gbps"];
    Core -> NodeD [label="10Gbps"];

    // Branch Connections
    NodeA -> SubA1;
    NodeA -> SubA2;
    NodeB -> SubB1;
    NodeC -> SubC1;
    NodeD -> SubD1;

    // Ring Interconnections (Best rendered in Circo or Neato)
    NodeA -> NodeB [style=dashed, constraint=false];
    NodeB -> NodeC [style=dashed, constraint=false];
    NodeC -> NodeD [style=dashed, constraint=false];
    NodeD -> NodeA [style=dashed, constraint=false];
}
Eliminating Syntax Friction with AI in VPasCode
Experimenting with advanced layout attributes—such as constraint=false, overlap=scalexy, or custom engine directives—can sometimes cause syntax errors or unexpected rendering output. Using VPasCode as your primary diagram-as-code platform provides your team with 1-Click AI Code Error Fixing to identify and resolve formatting glitches immediately.
Whether you are comparing layout algorithms, generating complex dependency trees, or designing database schemas, an intelligent browser-based Graphviz editor keeps your technical momentum moving forward.
Best Practices for Selecting Layout Engines
To ensure your technical documentation remains readable across different graph structures, follow these core guidelines when choosing an engine:
- Use
dotfor Directed Flows: Choosedotwhenever your data flows sequentially in a specific direction, such as pipeline stages, UML sequence charts, or flowchart logic. - Use
neatoorfdpfor Organic Meshes: Opt for force-directed engines when mapping unranked networks, peer-to-peer topologies, or social interaction graphs where directionality is secondary. - Export High-Resolution Vector Assets: Export crisp SVG or PNG assets directly from your browser-based Graphviz editor to embed in internal runbooks or publish online via Visual Paradigm OpenDocs integration.
Relying on a powerful browser-based Graphviz editor backed by a complete diagram-as-code platform enables software developers and systems engineers to build clear, production-ready diagrams for any dataset.
Optimize Your Diagram Layouts Today
Ready to master Graphviz layout engines and transform complex scripts into publication-ready diagrams? Try VPasCode’s feature-rich browser-based Graphviz editor today and experience instant 1-Click code error fixing, multi-format rendering, and seamless diagram-as-code capabilities.