
The summers in my region are quite dry, hot & rather unbearable. So, to get some refuge from all of this, I wanted to try out a few different measures, which would effectively reduce the temperature of my house. I thought a good starting point for this would be to establish a baseline and find out the standard deviation. To do this, I realized I’d need to observe the temperature & humidity of my house for a certain duration.

At the same time I’ve been trying to reduce the amount of content recommended to me by algorithms on social media, especially YouTube, Instagram & Reddit. Hacker News, with its rather transparent algorithm and RSS feeds of the authors I like seemed like a good start to take control of the content I consume, which is why I had set up miniflux, and it’s been going well. It’s just that I tend to miss some of the cutting edge stuff which appears regularly on HN. Especially with the AI/LLM stuff.

Also, I am interested in astronomical events like occultation of certain stars & planets by the moon or eclipses, etc., so that I can decide whether I can try to observe those with my telescope. Which is also related to my interest in knowing the air quality around my house.
While I was thinking this, I realized that I had an e-paper display that’s sitting in the electronics basket at the corner of my room, collecting dust. One fine day, I decided to use Claude Code to finally build something for it, and use it as a static display which serves things I mentioned above.
I had bought it from hubtronics.in a couple of years back, when I was working on a project which involved embedded programming on STM32/MC60. It’s the T5 e-Paper module from LILYGO. It has an ESP32 chip integrated, which supports WiFi & Bluetooth.
| Component | LILYGO T5 4.7" e-Paper |
|---|---|
| SoC | ESP32, dual-core Xtensa LX6 @ 240 MHz |
| Wireless | Wi-Fi 2.4 GHz (802.11 b/g/n), Bluetooth 4.2 + BLE |
| Memory | 520 KB SRAM · 8 MB PSRAM · 16 MB flash |
| Display | 4.7" e-Paper · 960 × 540 · 16-level grayscale (ED047TC1) |
| Extras | USB-C, Li-Po connector, RTC, ~170 µA sleep current |
User Interface
So, next question was how do I project this data on the display. The structure, form of the content, and what pieces of it need to grab my attention the most.
First Attempt
I started way too unstructured, and was caught off guard quickly. I hadn’t given any attention to the layout, and ended up printing everything as a single left aligned blob of text.
It was quite ugly, and I didn’t even click a picture of it.

Second Attempt
I decided to start with a simple design. It consisted of an HTTP server, which would collect all the feeds from external APIs, and serve it over HTTP as a JSON. This JSON, with a fixed schema/contract would be rendered by ESP32. ESP32 will periodically refresh the screen, after a successful API call to the server.
Then I prompted Claude to come up with a grid of 2x3 (height x width) and it quickly came up with a good enough render.
I then prompted it to do the attention grabbing bits where the most relevant pieces of information were made to appear bigger, concise and easy to grab attention.
Top row would show the weather, todo and AQI + stats. Bottom row would show HN, reading and date/time.
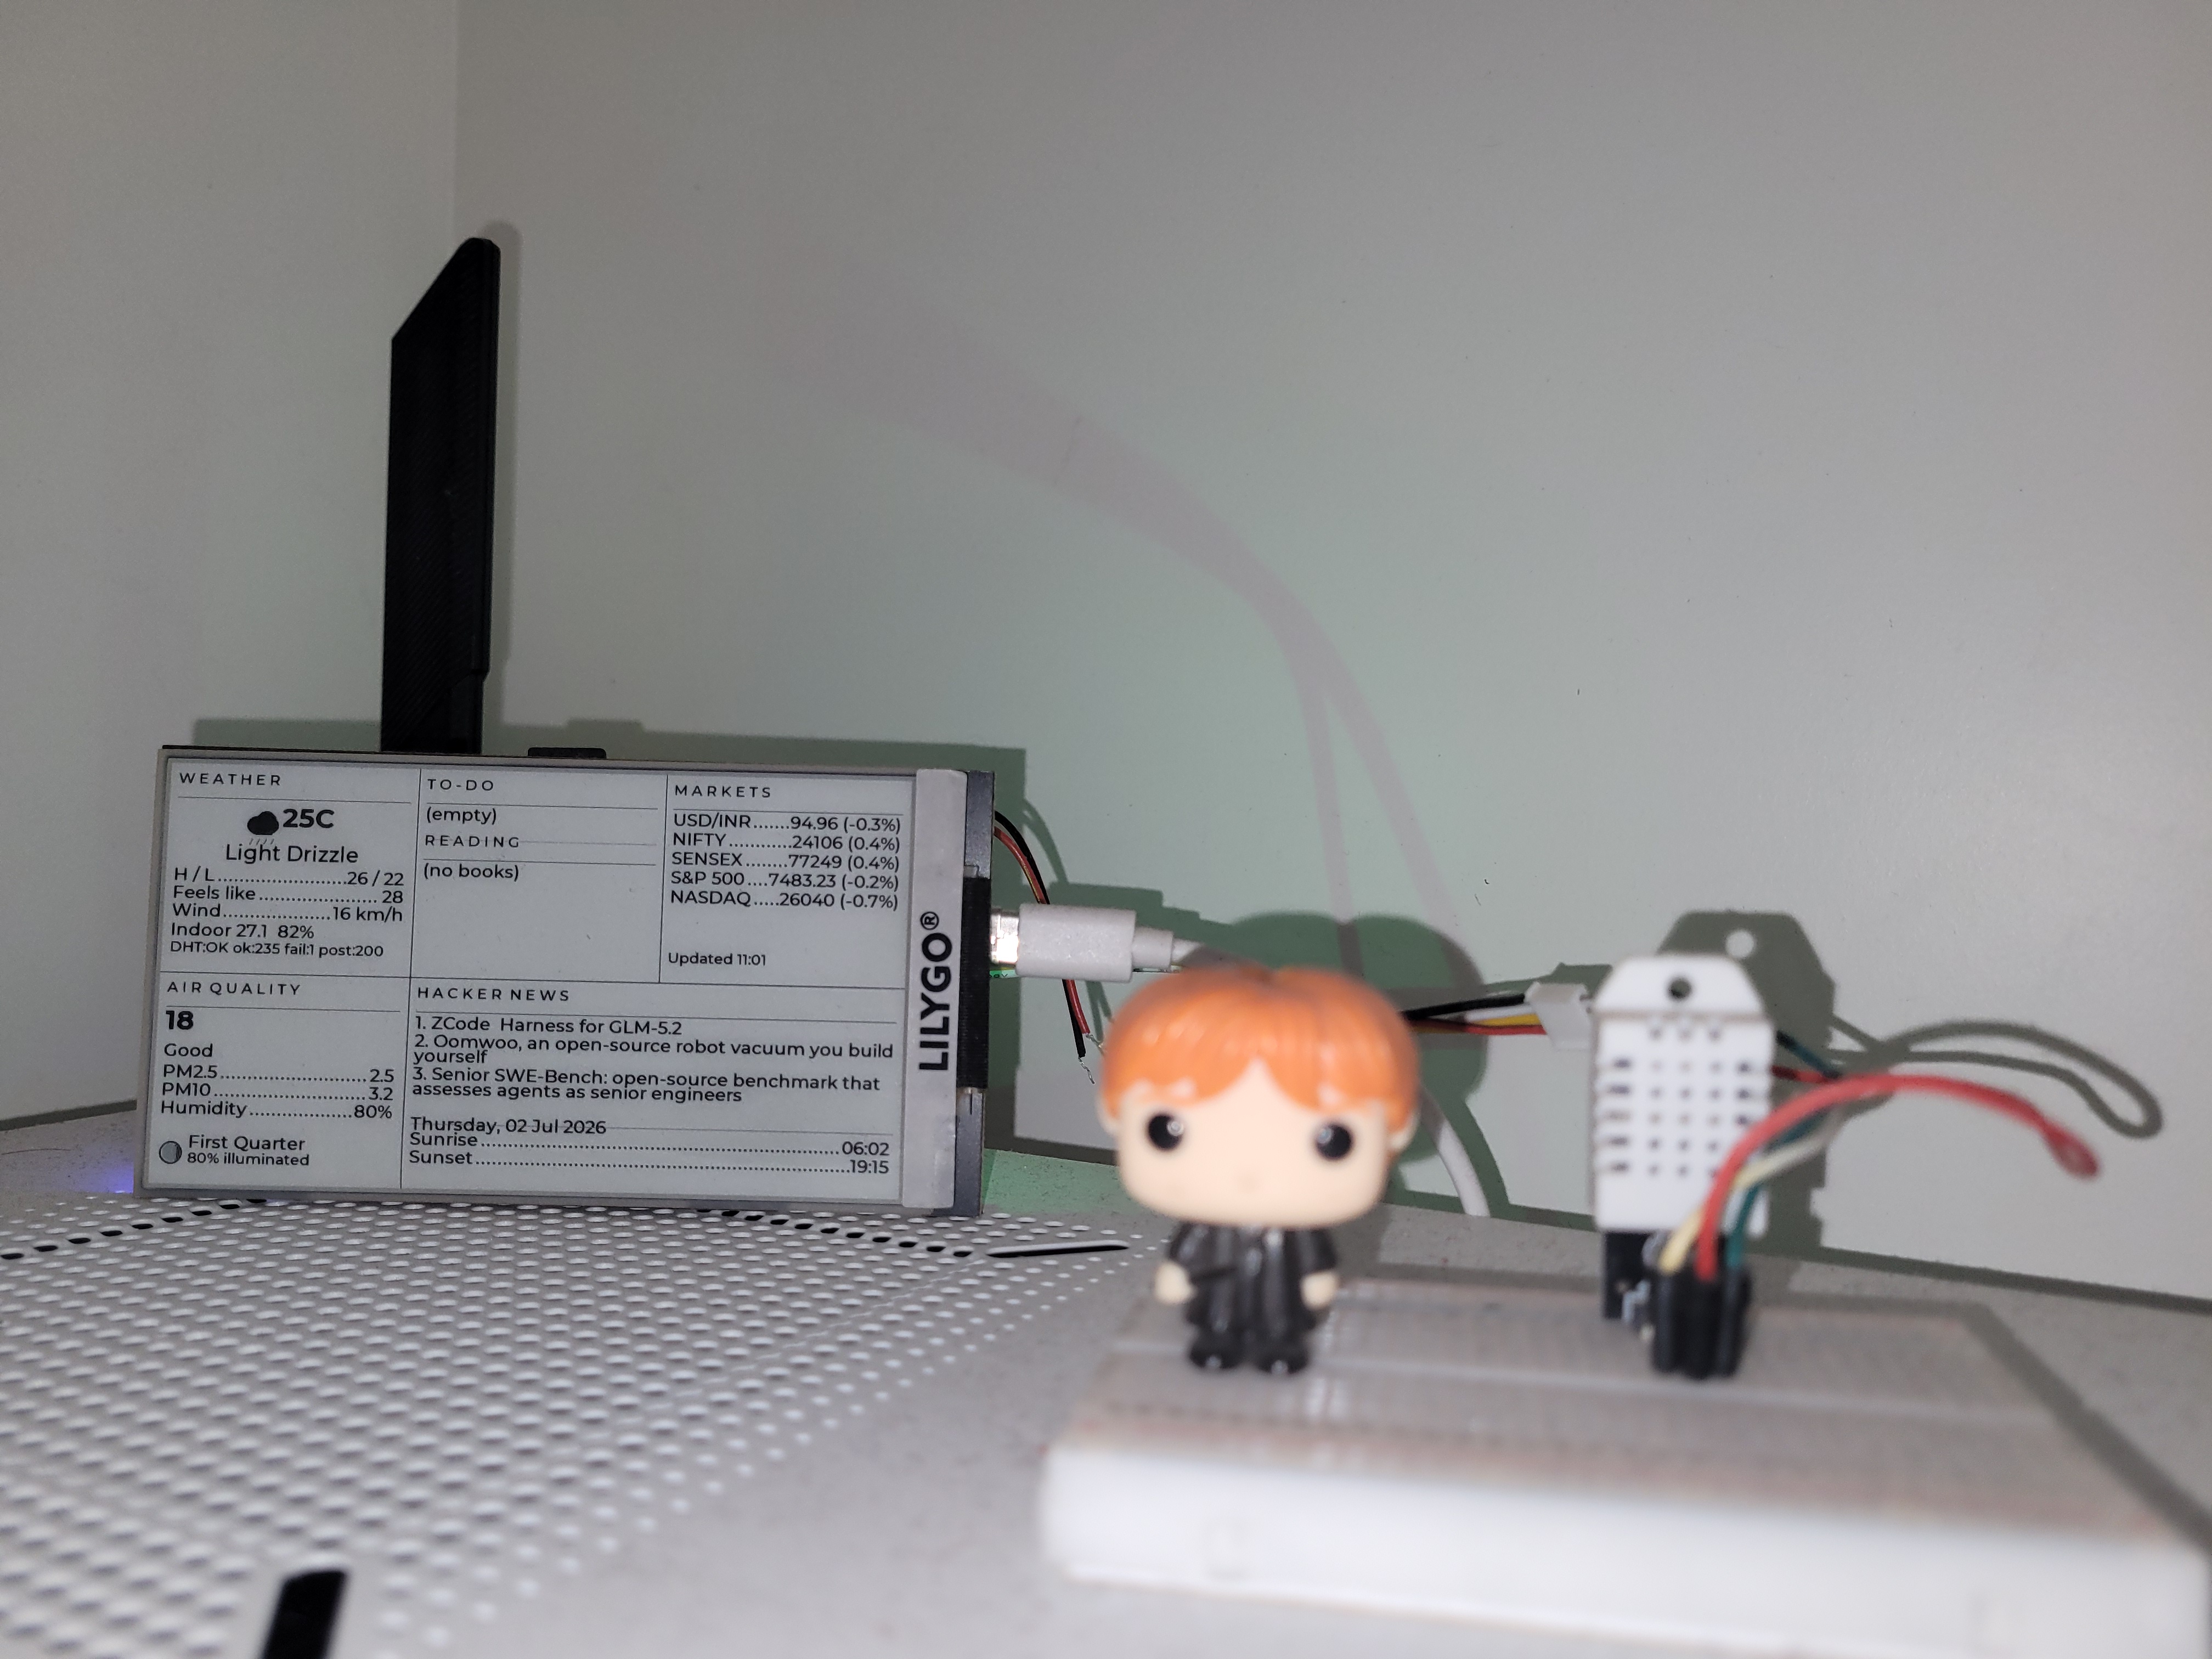
This worked well, except that the 320px cell for HN was too cramped for the headlines. Also, the date-time & reading were too thin to justify a full cell. So, I decided to merge the bottom-right two cells to create a double-wide HN zone. I also consolidated ToDo + Reading into one top-center cell. Markets would be at top-right, AQI + moon at left bottom. Date-time & Sunrise sunset would be at the bottom of the wide HN zone. I had to also fiddle around fonts, I started with OpenSans, and later moved to Montserrat, with different sizes for fit. I also moved away from image assets to all primitives, also added a few idioms, where titles would be uppercase & underlined.
Network Architecture
While I was iterating on the UI, I had flashed a static JSON with the ESP32 firmware, which was used to render the UI. I now had to wire the ESP32, over wifi/bluetooth so that it can fetch data wirelessly from the server.
I was quickly able to ship firmware, with a http url consisting of the internal IP address of the server. I asked Claude to implement a server in Clojure which served a static JSON.

I then decided to experiment around mDNS, tried the ESPmDNS for resolution. I couldn’t get it to work at all, even after iterating a couple of times using Claude to debug why the ESP is unable to resolve the mDNS hostname. Eventually, I gave up — things were still working fine at this point, and ESP32 could fetch and render a JSON from the server.
There were a few issues though.
- When I configured ESP32 to sleep after the rendering is done, and wake up after 10 mins to fetch the updated feed, it just wouldn’t wake up.
- If there was a fetch failure at the server, it would stop serving stuff, instead of serving last good value.
Also, I wanted to introduce a few more features:
- Indoor air quality using a sensor
- Integrating the TODO/Reading lists
- Change detection to skip e-paper refresh if data hasn’t changed.
I’ll cover these in the upcoming blog posts.
This is how the display looks:

Thanks for reading!