A text language for diagrams where you say where things go.
Try it in your browser → — edit the source on the left, watch the layout re-solve on the right. Nothing to install.
A diagram drawn by hand in draw.io:
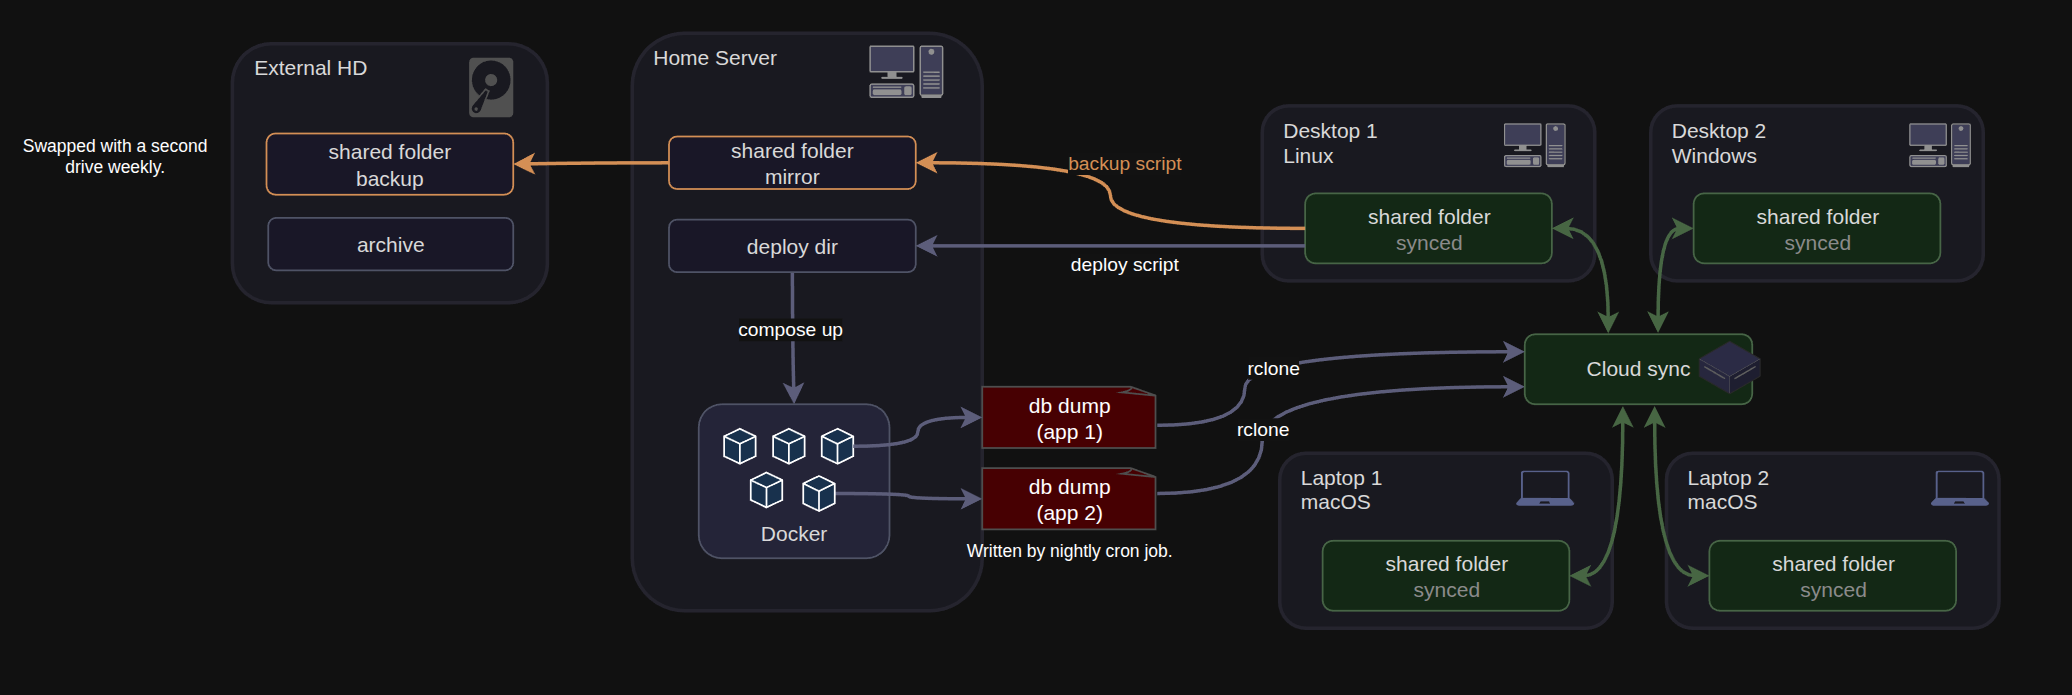
And the same diagram written down in reladraw and rendered from the text — examples/arch.reladraw, 44 statements, no coordinates anywhere in it:
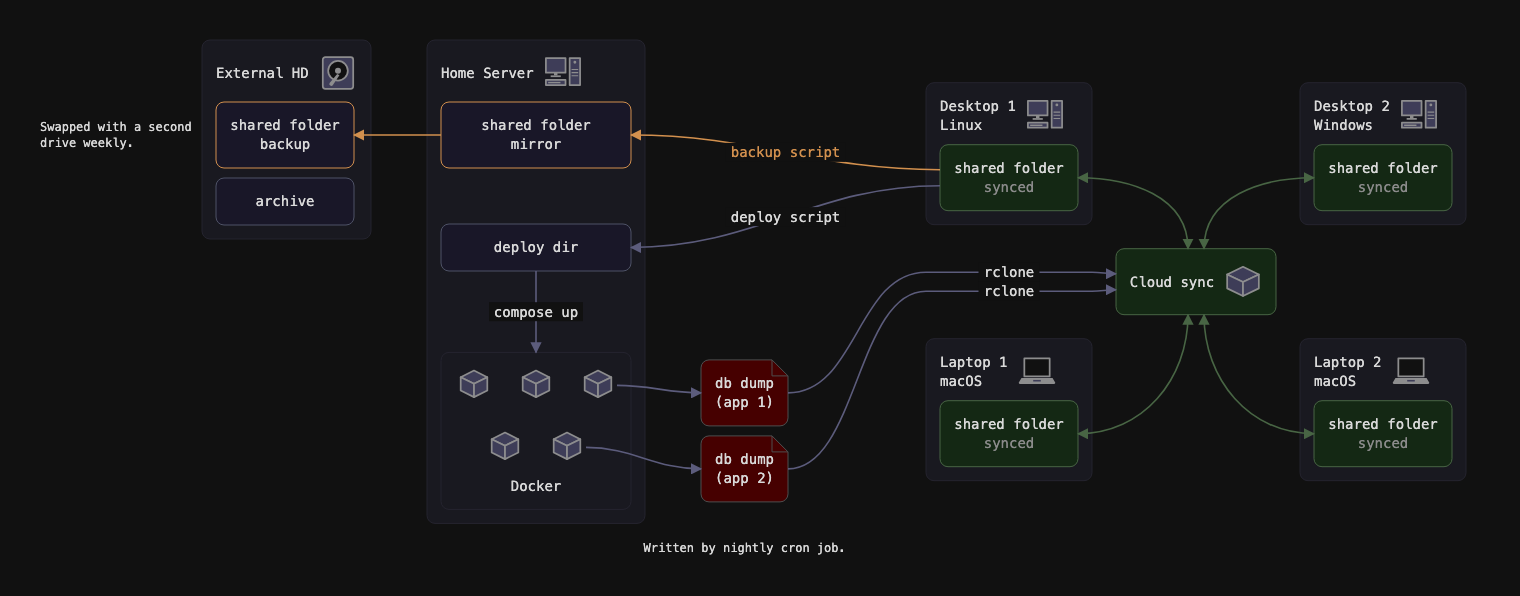
Every distance in the second picture was worked out from statements like above-left of cluster.hub and between cluster.desktop1 and cluster.laptop1. Nothing chose the arrangement; the file states it.
Mermaid, Graphviz and D2 have you declare entities and connections, and then place everything for you. That is a superpower, and for most diagrams it is the right one. It stops being the right one as soon as you have a particular picture in mind and care where things go. Say you are actively building your understanding of a system by diagramming it, and you want some module over to the right with its connections placed just so: the auto-layout languages have no way to say it.
On the other end of the spectrum are the absolute-positioning tools — draw.io, Excalidraw, Figma. They give you total control of placement, at the cost of making every edit to a complex diagram slow hand-work. And it is slow for a human but expensive for an agent, which has to work the picture out from the coordinates before it can decide which ones to change.
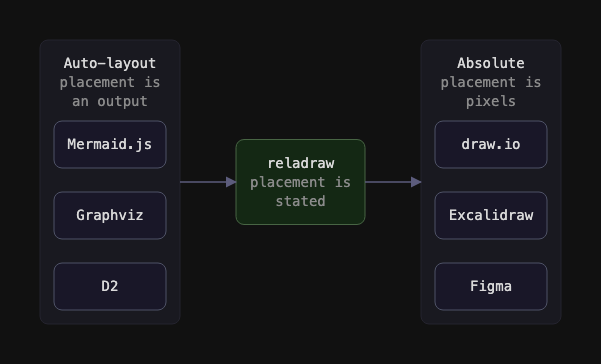
reladraw aims at the middle. Every position is stated relative to something else, and nothing in the file is a coordinate:
node app "Web app"
node app.ui  "Interface"
node app.api "API"  below app.ui

node store "Database"  right of app  level with app

edge app.api -> store  "queries"  from: right  to: left
Nothing is nested, so no line depends on another line's position or indentation.
The draft is in SYNTAX.md, with a worked example in examples/.
The common case is not drawing a diagram, it is changing one. Ask for the auth service to move left and a queue to go behind it. With pixel coordinates, an agent has to rebuild the picture from the numbers before it can work out which numbers to change. With auto-layout there is nothing to read at all, because the arrangement was never written down — it can only reword the source and re-render. With stated placement the arrangement is in the file as sentences, and changing the picture is changing the sentence that says where the thing goes.
Writing has the same shape. An agent emitting Mermaid is guessing at a layout that an algorithm settles later, and its only way to find out is to render and look — a round trip that comes back as a picture rather than as a list of what is wrong.
Intent is confirmable, outcomes are not, and the difference is worth being precise about. An agent can re-read its own file and see that the database is under the API and all four machines hang off the sync hub. It cannot see that two clusters anchored to different things now overlap, that a text overflowed its node, or that an edge crosses four others — those are resolved from the statements rather than stated, so they need the diagnostics in the scope section below.
reladraw is too new to be in any model's training data, so an agent has to be told the language before it can write it. This repository ships an agent skill that does exactly that — the syntax, when to reach for the language, and what re-reading its own source can and cannot confirm.
npx skills add reladraw/reladraw -g
That installs it for whichever agent you use — Claude Code, Codex, Cursor, Copilot and others — each into its own skills directory. Drop the -g to install it into the current project instead.
To install it for one agent rather than all of them, name it with -a:
npx skills add reladraw/reladraw -g -a claude-code
Re-run whichever command you used after a release that changes the syntax. The skill is a copy taken at install time, not a live link, so nothing refreshes it on its own.
It is plain Markdown with the syntax reference beside it, so it is worth reading whatever you use, and copying the directory by hand works just as well.
Version 0.4.0. Early, but it runs: a parser, resolver and SVG renderer in TypeScript with no runtime dependencies, and a command-line tool that takes a text file and writes a standalone SVG. The comparison at the top of this page is that pipeline run on examples/arch.reladraw. What is still visibly off there is typography, not placement.
npm install -g reladraw
reladraw diagram.reladraw -o diagram.svg
Or from a clone, which also gets you the examples:
npm install && npm run build
node dist/cli.js examples/arch.reladraw -o out.svg
Not built yet, roughly in the order they are missed:
- The diagnostics report. The scope section below says what it is for. Today the tool either renders or fails; it will not tell you what is wrong with a picture it drew successfully.
- Edge routing around nodes. An edge can be told which side of a node to leave and arrive on, and which gap to run down on the way. An edge that says none of that is a straight line between two centers, and it will cut through whatever stands in the way.
- More pictures. Icons and shapes are closed sets drawn from path data inside the tool, so a diagram wanting one that is not there has nowhere to go.
The language is not stable. Expect the syntax to change.
A gap is a minimum distance, never an exact one. Say two things sit side by side, then say a third goes between them, and the first two are pushed apart by exactly what the third needs; delete the third and they close back up. That is the step an author otherwise does by hand — shove things apart to make room, then drag everything back so the diagram is not full of holes — and no number goes stale when a text grows.
So the resolver solves a system rather than walking a chain. Each axis is a set of minimum distances, and the tightest arrangement satisfying all of them is found by longest paths: one answer, no search, no arrangement ever tried and rejected. The engine works out distances; which side of what a thing sits on came from the file.
That is also what makes non-overlap affordable, so it holds for every pair of nodes without anyone writing it down. On its own "these two must not overlap" is a choice among four directions, which is the search this design refuses — but the file has usually settled it already: if your arrangement lets one node travel away from another and offers no way back, that is the only separation it permits. Where the file orders a pair on neither axis, the tool names them rather than guessing; where it orders them on both, the tie breaks toward the axis of least overlap, which is the smallest movement and the one place the tool decides something nobody wrote.
Nothing is nudged. Each round derives the separations the file already implied, adds them as ordinary minimum distances, and solves the whole thing again from scratch — repairing a solved layout in place is the thing being avoided.
- Parser (done)
- Deterministic resolver: minimum distances in, tightest arrangement out (done)
- Static SVG renderer (done)
- A command-line tool: text file in, SVG out (done)
- A placement grammar that can say what a real diagram needs: several placements on one node, one thing between two others, exact side-to-side alignment (done)
- Nodes that do not overlap by default, with the separation direction derived from the stated arrangement (done)
- Minimal node-avoiding edge routing
- Machine-readable diagnostics from the solved geometry
Diagnostics are a real output rather than a debugging aid. What they cannot do is stand in for the grammar: a check catches only what the language genuinely leaves open, and "these must not overlap" rules arrangements out without naming one, so it can never place anything. Everything the source cannot tell you is computable once the geometry is solved, with no image involved: overlapping nodes, crossed edges, text exceeding its container, anything off-canvas, large dead regions. So the tool reports hub overlaps laptop1 and edge auth->db crosses 4 edges, and the fix is written in the same vocabulary as the source. An agent working this way reads a report about a text file it wrote and edits that text file — no rendering, no vision model, no pixel arithmetic.
A diagnostic never repairs a solved layout in place. That is the line the design holds: a checker allowed to nudge nodes is a layout algorithm with a bad search strategy, fixing one overlap into the next with no view of the whole. Deriving a constraint the file already implied and solving the whole system again is a different thing, and is how non-overlap works. What is left over — anything the source genuinely does not settle — is reported, naming the statement that was broken, and the author edits the source. Open, and it decides how far this goes: may a diagnostic describe a fix in words, or only name the symptom? Describing one means the tool has an opinion about layout, which is the auto-layout instinct coming back in through the side door.
Three design problems decide how much machinery this needs, and the first outranks the other two:
Saying enough. The benchmark contains arrangements the grammar cannot express at all, which is why some nodes land in the wrong place no matter how the file is written. So the work is adding statements, not restricting them. Expressiveness is not the danger; the engine choosing an arrangement is.
What the engine is allowed to decide. Auto-layout is refused, because a picture chosen by an algorithm is not predictable from its source, and that predictability is the entire point. Working out coordinates from an arrangement the author stated is a different thing and is simply the job. The test between them: the engine's freedom may affect distances and never relationships. If a default can change which side of something a node sits on, the language was short a statement and the tool should say so rather than guess.
Overlap and edge routing. Relative placement with default spacing collides as soon as two clusters grow toward each other. Stating placement and then routing edges afterward with no influence on them reproduces the exact failure this is meant to avoid, so minimal node-avoiding orthogonal routing belongs in the first version. Routing and diagnostics are complements, not substitutes: routing fixes what it can, and the diagnostics report what it could not.
Four things sit near this, and each answers a different part of the problem.
Archify. Built for agents to write: an agent emits typed JSON, a validator checks it against a schema and lints the layout, and it compiles deterministically to a good-looking, self-contained HTML file, with stepped playback and nodes pinned to git-verified source lines. Its positioning is grid or free coordinates, though — auto-arrangement on one side, absolute pixels on the other — and a JSON template says nothing about where the picture will end up, so the loop is still emit, render, look, tweak.
PIC and pikchr. A text diagram format with no layout engine, where placement is stated and deterministic. But it is turtle graphics — a movable cursor that drops shapes and steps along — so a diagram is a sequence of pen movements rather than a set of stated relationships between named things. There is no group that reflows when a member is added.
Graphviz rank and cluster. Constraints on an auto-layout engine rather than a replacement for one, so output stays emergent and unpredictable from the source.
Structurizr. Has real manual layout, but is bound to the C4 model, which makes it a modeling notation with a renderer attached rather than a general placement language.
Apache-2.0. This is a reusable primitive where adoption is the value, so restricting commercial use would defeat the purpose. See LICENSE.
The license covers the code, not the name: it grants no rights to use "reladraw", the project logo, or the project's other marks. Forks are welcome and should carry a different name. See NOTICE.
Issues are wanted — especially a diagram you tried to write and could not. Pull requests are read but not merged yet, for a reason explained in CONTRIBUTING.md.