While the government may be able to fake BLS and CPI data to gloss over the fact that 5.5% rates have already likely driven the nation into a deep recession, independent data on the housing market is showing a decades-long shortage in inventory starting to rebound.
A new report from Construction Coverage has revealed where the largest increases in real estate inventory in the U.S. are taking place.
The report notes that the current housing shortage—which is now estimated to be between four million and seven million homes—can trace its beginnings to long before the COVID-19 pandemic. In the 10 years following the Great Recession, the United States constructed fewer new homes than in any other decade since the 1960s.
They write that the lack of housing affects certain areas more severely than others. Researchers ranked locations based on the percentage change in the average monthly housing inventory—the total number of active listings plus pending sales at the end of the month—between Q1 2023 and Q1 2024.
Data from a national level showed that U.S. housing inventory decreased from more than two million in 2012 to a low of approximately 630,000 at the start of 2022.
Over the same period, months’ supply—a measure of how long it would take existing inventory to sell if no new homes came on the market—plummeted from a national high of 7.5 months to a historic low of 1.1 months, the report adds.
It also noted that inventory has rebounded slightly since early 2022: throughout the first quarter of 2024, the national inventory hovered around 970,000 homes for sale, marking a 4.0% year-over-year increase.
Despite this uptick, existing inventory would sustain the current sales pace for just 2.9 months—a marginal increase from the 2.8 months’ supply recorded last year.
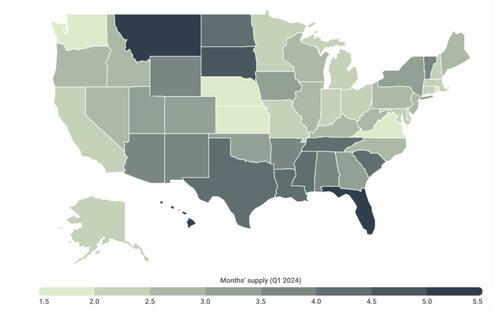
The report broke down trends by cities and states, finding that as of the first quarter of 2024, states with the lowest levels of supply are concentrated in and around the Midwest (such as Kansas with 1.5 months of supply) and the Northeast (including Rhode Island with 1.8 months of supply).
However, Washington also stands out for having some of the lowest levels of available housing nationally, with just 1.9 months of supply.
In contrast, several states in the South, led by Florida (5.2 months of supply), along with Hawaii (5.2 months) and Montana (5.1 months), present notably more favorable conditions for buyers.
Among the nation’s largest cities, Denver, El Paso, and Dallas recorded the largest year-over-year increases in housing inventory. At the opposite end of the spectrum, Las Vegas, Raleigh, and Chicago recorded the biggest declines.
The data is hardly a 2008-style collapse, but that doesn't mean it isn't noteworthy.
While the 'turning of the tide' still remains muted, the housing market is so large it rarely corrects swiftly. It's important to notice, however, that rising inventory ticking higher - combined with mortgage rates now over 7% - could easily be telegraphing a correction in prices heading into 2025.
You can view the entire study here.

