
|
|
|
| Is Visual Basic still a thing? That was my start and it always felt like a good intro language. It was limiting but you could still make "real" desktop apps. |
|
| > I think we need to differentiate
My read of this post (especially the title) is the author does differentiate normally but chose to blur the lines here for a narrative hook & a little bit of fun. |
|
| I think quite interesting starting point is general purpose visual medium which is good enough to be used for programming, too.
Aka: more visual/structured medium to some use cases we use text today. |
|
| > The schematic capture elements to connect up large blocks of HDL with a ton of I/O going everywhere are one of the few applications of visual programming that I like.
Right. Trying to map lines of code to blocks 1 to 1 is a bad use of time. Humans seem to deal with text really well. The problem becomes when we have many systems talking to one another, skimming through text becomes far less effective. Being able to connect 'modules' or 'nodes' together visually(whatever those modules are) and rewire them seems to be a better idea. For a different take that's not circuit-based, see how shader nodes are implemented in Blender. That's not (as far as I know a) a Turing complete language, but it gives one idea how you can connect 'nodes' together to perform complex calculations: https://renderguide.com/blender-shader-nodes-tutorial/ A more 'general purpose' example is the blueprint system from Unreal Engine. Again we have 'nodes' that you connect together, but you don't create those visually, you connect them to achieve the behavior you want: https://dev.epicgames.com/documentation/en-us/unreal-engine/... > I don't think there's many analogous situations in typical programming applications that call for timing diagrams Not 'timing' per se (although those exist), but situations where you want to see changes over time across several systems are incredibly common, but existing tooling is pretty poor for that. |
|
| i remember using the falstad sim constantly at university a decade ago. super helpful and so much more intuitive than any spice thing. cool to see that it's still around and used |
|
| +1
I'd add versioning and diff tools as another critical advantage for text. If your visual tool can't provide a superior diff experience, then it's dead on arrival for most serious projects. |
|
| These are standardized IEC 61131-3 languages https://en.wikipedia.org/wiki/IEC_61131-3
Ladder, SFC and FBD are all graphical languages used to program PLC's. Ladder is directly based on electrical ladder schematics and common in the USA. The idea was electricians and plant technicians who understood ladder schematics could now program and troubleshoot industrial computers. SFC and FBD were more common in Europe but nowadays you mostly see Structured Text, a Pascal dialect (usually with bolted on vendor OOP lunacy.) I will admit that for some programs, Ladder is fantastic. Of course ladder can be turned into horrid spaghetti if the programmer doesn't split up the logic properly |
|
| What would be useful is a data flow representation of the call stack of a piece of code. Generated from source, and then brought back from the GUI into source. |
|
| > How does version control work with Labview?
Labview does have diff and merge tools. It feels kind of clunky in practice, kind of like diffing/merging MS Office files. In my experience people think of versions of LabView code as immutable snapshots along a linear timeline and don't really expect to have merge commits. Code versions may as well be stored as separate folders with revision numbers. The mindset is more hardware-centric; e.g., when rewiring a physical data acquisition system, reverting a change just means doing the work over again differently. So LabView's deficiencies in version control don't stand out as much as they would in pure software development. https://www.ni.com/docs/en-US/bundle/labview/page/comparing-... |
|
| There's a JSON format of the blueprints that you can see when you copy/paste. Its just a bit ambiguous than the usual binary format. Its not an impossible problem at all. |
|
| Not an impossible problem only in theory. It's currently practically impossible and will take at least a year to solve if anybody starts to work on this at all.
Since my current project does involve wrangling AI to do stuff - forcing it to output a consistent, complete, large JSON with an exact specific format is very difficult and takes a lot of time (you won't be able to draw Blueprints line by line to show to the user that AI is processing). Definitely no autocomplete-like experiences maybe ever. For example, look at the text representation of these 6 (!) nodes: https://blueprintue.com/blueprint/yl8hd3-8/ It's enormous. And the second even bigger problem: On forums and basically everywhere all users share screenshots with descriptions. There's not enough training data for anything meaningful. I tried to force copilot/gpt to output even a small sample of copy-pastable blueprint and it just can't. |
|
| > Unity has had multiple visual programming packages and people don't really care.
People cared enough for Unity to buy one and make it official but Unity doesn't care so it mostly just rots. |
|
| > A basic problem I have, looking at an Excel spreadsheet, is I don't know which cells are calculated by a formula, which are constants.
Use Ctrl-` (show formulas). |
|
| Stil impossible to know what a Excel sheet does only by looking at it. The 2d grid obfucates the relationships between data.
Power BI does (almost) everything Excel does but better. |
|
| From what I've seen when code is generated from formal specs it ends up being inflexible. However, do you think it would be valuable to be able to verify an implementation based on a formal spec? |
|
| > Schematix provides diagrams as a dynamic resource using its API. They aren't images you export, they don't end up in My Documents. This isn't Corel Draw. In Schematix, you specify part of your model using a graph expression, and the system automatically generates a diagram of the objects and relations that match. As your Schematix model changes, the results of the graph expression may change, and thus the visual diagram will also change. But the system doesn't need you to point and click for it. Once you've told it what you want, you're done.
What an interesting tool! It's rare to see robust data models, flexible UX abstractions for dev + ops, lightweight process notations, programmatic inventory, live API dashboards and a multi-browser web client in one product. Do you have commercial competitors? If not, it might be worth doing a blog post and/or Show HN on OSS tooling (e.g Netbox inventory, netflow analysis of service dependencies) which offer a subset of Schematix, to help potential customers understand what you've accomplished. Operational risk management consultants in the finance sector could benefit from Schematix, https://www.mckinsey.com/capabilities/risk-and-resilience/ou.... Lots of complexity and data for neutral visualization tooling. |
|
| I forget its name, but there was an IBM graphical tool , with which you create UML diagrams and it in turn created code (Java IIRRC).
The intermediate representation was in sexp ! |
|
| I'm going to throw a vote in here for Grasshopper, the visual programming language in Rhino3d as doing it the right way. It is WIDELY used in architectural education and practice alike.
Unfortunately, most visuals you'll get of the populated canvas online are crap. And for those of us who make extremely clean readable programs it's kind of a superpower and we tend to be careful with how widely we spread them. But once you see a good one you get the value immediately. Here's a good simple program I made, as a sample. [0] Also, I want to give a shout-out to the Future of Coding community in this. The Whole Code Catalog [1] and Ivan Reese's Visual Programming Codex [2] are great resources in the area. I also have to mention, despite the awful name, Flowgorithm is an EXCELLENT tool for teaching the fundamentals of procedural thinking. [3] One neat thing is you can switch between the flow chart view and the script code view in something like 35 different languages natively (or make your own plugin to convert it to your language of choice!) p.s. If you are used to regular coding, Grasshopper will drive you absolutely freaking bonkers at first, but once you square that it is looping but you have to let the whole program complete before seeing the result, you'll get used to it. [0] https://global.discourse-cdn.com/mcneel/uploads/default/orig... [1] https://futureofcoding.org/catalog/ |
|
| Agreed, Rhino/Grasshopper is an amazing tool, especially once you start adding in C# components.
I’ve been using it off and on for several years on custom consumer product projects. It’s an under utilized workflow in many fields requiring 3D modeling imo.
I just finished a custom VR gasket generator for the Quest 3 that uses face scans from iPhone as the input and the project wouldn’t have been possible without Grasshopper:
https://youtu.be/kLMEWerJu0U
|
|
| That's rad - thanks for sharing! I'll try to watch the whole thing when I'm not on deadline.
My jewelry work [0] is almost all in Grasshopper, as I've built up such a workflow there over the past... 8 years? that I don't need custom tools for most of it. But my research work is all about building custom tools in C#. In fact I just finally published my component library yesterday [1]. Frankly I should have released it years ago, but I finally just bit the bullet. [0] https://Xover0.com [1] https://www.food4rhino.com/en/app/horta |
|
| Yes, definitely this.
I have worked for a couple years on webMethods, where programs can ONLY be created by "drawing/composing" sort of flowcharts (see https://stackoverflow.com/q/24126185/54504 ) and the main problem was always trying to search for stuff inside the "Codebase".
And... another benefit of purely text-based code is that you can always run a diff-like utility and quickly zoom in on what has been changed.
|
|
| I simply have to recommend Glamorous Toolkit to anyone interested in visual programming: https://gtoolkit.com
It focuses on the kind of visual programming the article argues for: Class layout, code architecture, semantics. It's one of the best implementations I have seen. The authors are proponents of "moldable development", which actively encourages building tools and visualizations like the ones in the article. |
|
| Mindstorms is an example of what did not work. I want to provide an example of what does. BBC microbits. It has a visual programming interface that is translatable to python or JavaScript . |
|
| Those two are both primarily for real time signals and music right? That is a great domain for wires, transforms, and pipelines.
Have you ever seen them used in a different context? |
|
| Sequence diagrames (that seems not much different swimlane diagrams) are great, so much so that I created a tool that generates them from appropriately built TLA+ specs representing message exchange scenarios: https://github.com/eras/tlsd
However, while they are good for representing scenarios, they are not that good for specifying functionality. You can easily represent the one golden path in the system, but if you need to start representing errors or diverging paths, you probably end up needing multiple diagrams, and if you need multiple diagrams, then how do you know if you have enough diagrams to fully specify the functionality? > The protocol is complicated enough for me to think that the diagrams are the source of truth of the protocol. In other words, I'd venture to say that if an implementation of the Double Rachet algorithm ever does something that doesn't match the diagrams, it is more likely it is the code that is wrong than vice-versa. I would believe the latter statement, but I wouldn't say the first statement is that said in other words, so I don't believe this is the correct conclusion. My conclusion would be that diagrams are great way to visualize the truth of the protocol, but they are not a good way to be the source of truth: they should be generated from a more versatile (and formal) source truth. |
|
| Virtually everything safety critical (cars, planes, biomedical..) uses Simulink which is not shown or mentioned by this post and it works fine for very large apps. |
|
| I think scratch with a little more structure and lots of keyboard shortcuts would work for a "real" language.
It's really just replacing indentation with blocks of color. |
|
| "if you connect to source control within the editor you can at least diff blueprints to compare changes. though it's currently not possible to actually merge them."
https://www.reddit.com/r/unrealengine/comments/1azcww8/how_d... So it seems like basic functionality like merge is still missing from visual coding in Unreal. But yes, there were also huge projects before the invention of distributed version control systems. But that wasn't a good world and why go back? P.S.: Have you ever tried to merge two different excel files? |
|
| The fundamental problem in visual programming is that it limits you to geometry (practically to 2D euclidian space). Most non-trivial programming problems are spaghetti by nature in such spaces. |
|
| > If anything, the more complex a problem is, the more cluttered the visual language form ends up being, and feels overloading my visual memory
I feel like you are more concerned about implementation than the idea itself. For me it's the opposite - I find it's easier to understand small pieces of text, but making sense of hundreds of 1k lines files is super hard. Visual programming in my understanding should allow us to "zoom" in and out on any level and have a digestible overview of the system. Here is an example of visual-first platform that I know is used for large industrial systems, and it allows viewing different flows separately and zooming into details of any specific piece of logic, I think it's a good example of how visual programming can be: https://youtu.be/CTZeKQ1ypPI?si=DX3bQSiDLew5wvqF&t=953 |
|
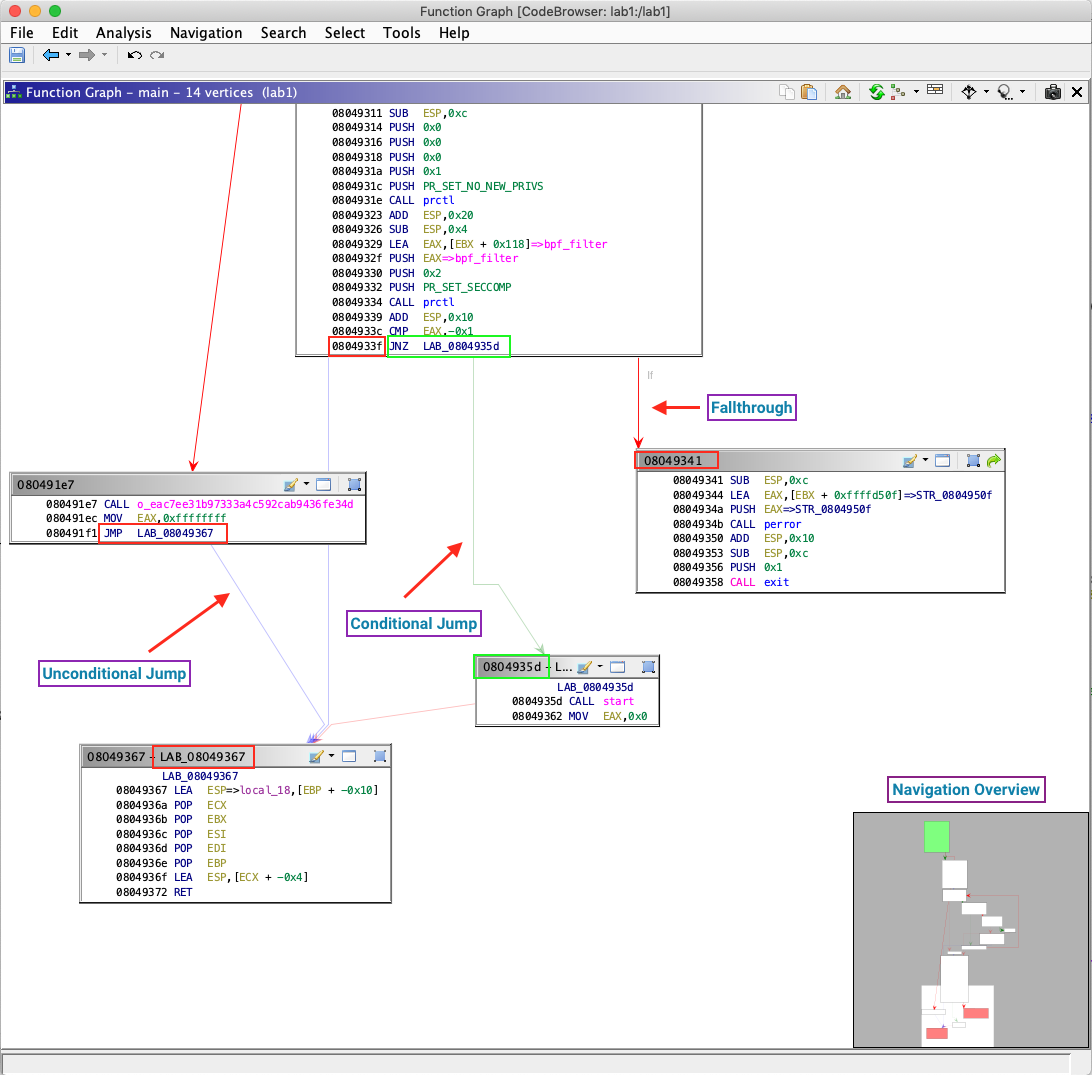
| And yet IDA and Ghidra use that same 2d representation structure for basic blocks (e.g. https://byte.how/images/ghidra-overview/graph-edges.png ) showing code flow between the blocks
I have had better-than-average success representing the high level sequence of computer-y actions using sequence diagrams, and suspect strongly my audience would not have the same comprehension if I used pseudocode or python or C++ Where I think the anti-visual programming audience and I can agree is the idea of a standard library, since a bunch of diagrams showing a "length" message being sent to a String object is for sure the wrong level of abstraction. In that way, I'd guess the DSL crowd would pipe up and say that is the same problem a DSL is trying to solve: express the code flow in terms of business nouns and verbs, and let the underlying framework deal with String.length nonsense I've seen a hybrid approach to this in a few testing frameworks, such as Robot Framework <https://robotframework.org/robotframework/latest/RobotFramew...> |
|
| I don't think extra dimensions help. Even simple functions have easily tens of interconnected references and representing these spatially is gonna be a mess even in higher dimensions. |
|
| How is `if` related with creating a new line? And how does new line make something 2D? If code was 2D you could write code anywhere in your document without juggling around spaces and newlines |
|
| The problem with most visual programming is that most platforms avoid making any tradeoffs.
A good visual programming tool should abstract away complexity but it can only achieve that by reducing flexibility. If you're going to give people a visual tool that is as complex as code itself, people might as well learn to code. It helps to focus on a set of use cases and abstract away from common, complicated, error-prone, critical functionality such as authentication, access control, filtering, schema definition and validation. All this stuff can be greatly simplified with a restrictive UI which simultaneously does the job and prevents people from shooting themselves in the foot. You need to weed out unnecessary complexity; give people exactly the right amount of rope to achieve a certain set of possible goals, but not enough rope for them to hang themselves. I've been working towards this with https://saasufy.com/ I've chosen to focus on CRUD apps. The goal is to push CRUD to its absolute maximum with auth, access control and real time data sync. So far it's at a point that you can build complex apps using only HTML tags. Next phase would be to support generating and editing the HTML tags via a friendly drag and drop UI. Still, it's for building front ends. It cannot and will never aim to be used to build stuff like data processing pipelines or for analytics. You'll need to run it alongside other services to get that functionality. |
|
| I'm working on visual programming for Python. I created an Python editor, that is notebook based (similar to Jupyter) but each cell code in the notebook has graphical user interface. In this GUI you can select your code recipe, a simple code step, for example here is a recipe to list files in the directory https://mljar.com/docs/python-list-files-in-directory/ - you fill the UI and the code is generated. You can execute code cells in the top to bottom manner. In this approach you can click Python code. If you can't find UI with recipe, then you can ask AI assistant (running Llama3 with Ollama) or write custom python code. The app is called MLJAR Studio and it is a desktop based application, so all computations are running on your machine. You can read more on my website https://mljar.com
|
This post seems to still focus the former while an earlier HN post on Scoped Propagators https://news.ycombinator.com/item?id=40916193 showed what's possible with the latter. It specifically showed what's possible when programming with graphs.
Bret Victor might argue visualizing a program is still "drawing dead fish".
The power of visual programming is diminished if the programmer aims to produce source-code as the final medium and only use visualization on top of language. It would be much more interesting to investigate "visual first" programming where the programmer aims to author, and more importantly think, primarily in the visual medium.