
Authored by David Stockman via InternationalMan.com,
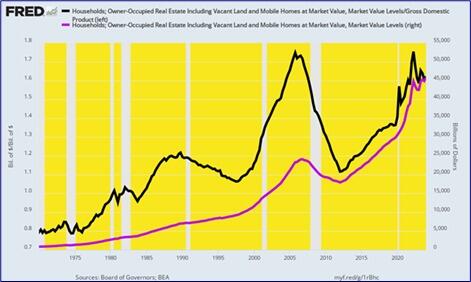
America’s bubblicious economy will soon hit another milestone of sorts—-the $50 trillion mark with respect to the market value of owner-occupied residential real estate. At the present moment, this figure (purple line) stands at $46 trillion (Q1 2024), which is nearly 2X its pre-crisis level of $24 trillion in Q4 2006. It’s also 8X its level when Greenspan took the helm at the Fed ($5.6 trillion) after Q2 1987 and a staggering 51X the $900 billion value of all owner-occupied homes when Tricky Dick did the dirty deed at Camp David in August 1971.

Needless to say, neither household incomes nor the overall US economy have grown at anything near those magnitudes. For instance, nominal GDP is up by 24X or less than half the gain in housing values since Q2 1971. As a consequence, the value of owner-occupied housing relative to GDP has climbed steadily higher over the last 50 years:
Market-Value of Owner-Occupied Housing As % of GDP Since 1971:
-
Q2 1971: 79%.
-
Q2 1987: 117%.
-
Q4 2006: 172%.
-
Q1 2024: 175%.
Market Value of Owner-Occupied Real Estate And % Of GDP, 1970 to 2024
Here’s the thing. The US economy was downright healthy in 1971. During the 18 years between 1953 and 1971 real median family income rose from $38,400 to $62,700 or by a robust 2.8% per annum. So the fact that residential housing represented only 79% of GDP at that point was not indicative of some grave deficiency or structural malfunction in the US economy.
Indeed, when you note that real median family income rose by only 0.8% per annum during the most recent 18 year period, or by just 29% of the 1953-1971 rate, you might well conclude that it would have been wise to leave well enough alone. Not only was the main street economy prospering mightily, but it was being accomplished with honest interest rates owing to Fed policy that was constrained by the Breton Woods gold exchange standard and also by the sound money philosophy that prevailed in the Eccles Building during the William McChesney Martin era.
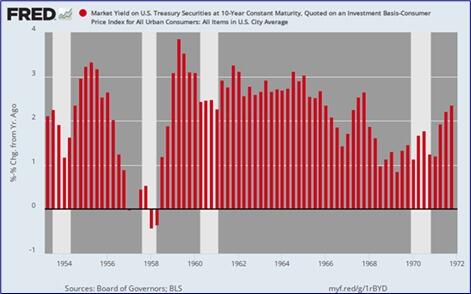
As shown below, the 10-year UST benchmark rate during that period exceeded the CPI inflation rate by more than 200 basis points most of the time, save for brief periods of recession. Yet the US economy thrived, real living standards rose steadily and the residential housing market literally boomed.
Inflation-Adjusted Yield On 10-Year UST, 1953 to 1971
The subsequent period between 1971 and 1987, of course, was racked first by the double digit inflation of the 1970s and then the brutally high nominal interest rates that issued from the Volcker Cure during the first half of the 1980s. But by 1986 consumer inflation was back to just below 2% and heading lower, thereby paving the way for interest rates to normalize to a low inflation economy.
But the new Fed chairman, Alan Greenspan, had other ideas. Namely, the notion that “disinflation” as opposed to no inflation was good enough for government work; and also that the Fed could actually improve upon the jobs and income performance of the main street economy via what he labeled the “wealth effects” doctrine. That is, if the Fed kept Wall Street percolating happily and the stock indices rising robustly, the increased wealth among households would kindle capitalist animal spirits, thereby fueling enhanced spending, investment, growth, jobs and incomes.
Notwithstanding Greenspan’s mumbling and opaque messaging, what he was doing actually amounted to monetary humbug as old as the hills. He launched an era in which real interest rates were pushed steadily and artificially lower to the zero bound and below on the theory that rates well below what would otherwise prevail under honest supply and demand conditions on the free market would elicit an enhanced level of economic growth and prosperity.
It never happened on a sustained basis, of course, because below market interest rates only cause an accumulation of above normal debt levels in the public and private sectors alike—along with widespread economic distortions and malinvestment on main street, unsustainable leveraged speculation on Wall Street and, at best, the swapping of more economic activity today for reduced activity and higher debt service tomorrow.
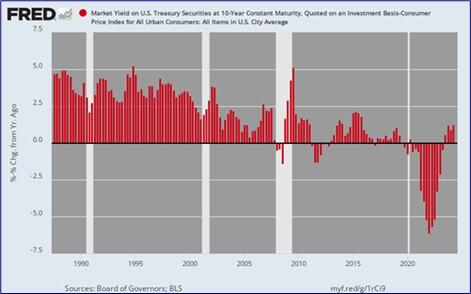
In any event, the inflation-adjusted benchmark US Treasury rate marched virtually downhill for the next three decades, ending deep in negative territory by the early 2020s. The ill-effects were widespread throughout the economy and in this instance turbo-charged by the deep tax preferences for home mortgages. So the inflow of cheap debt into the residential housing market was massive and sustained.
There is no mystery as to why: Economic law says that when you subsidize something heavily, you get more of it. And the implicit Fed subsidies depicted in the graph below were heavy indeed.
Inflation-Adjusted Yield On the 10-Year UST, 1987 to 2024
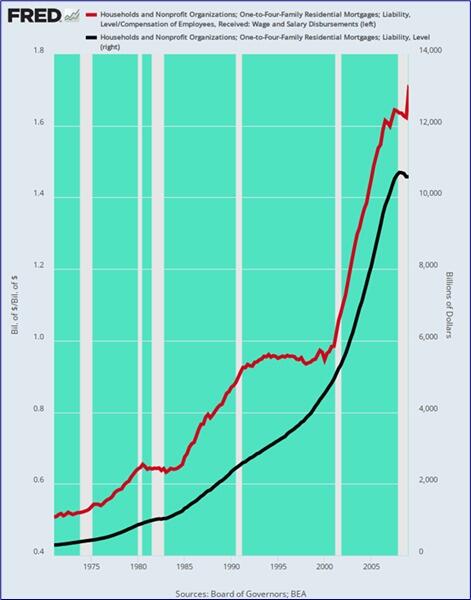
Needless to say, economic law had its way with the residential mortgage market. Big time. Household mortgage debt (black line) had stood at $325 billion or just 50% of household wage and salary income (purple line) back in 1971. But by the peak of the subprime borrowing spree in 2008-2009, mortgage debt had risen by 33X to nearly $11 trillion.
Consequently, the mortgage debt burden soared to 170% of household wage and salary income before abating modestly during the period since 2009. But the point is, the Fed’s severe interest rate repression during that period caused a financial arms race in the residential housing market—with ever more debt pushing housing prices ever higher.
In short, it wasn’t the free market or even steadily rising, albeit more slowly growing, GDP that caused residential housing values to go from 79% of GDP in 1971 to 175% of GDP at present. Instead, it was a sustained, fiat credit fueled tidal wave of housing price inflation—a financial torrent that bestowed large windfalls on earlier period buyers (i.e. Baby Boomers) while progressively squeezing later comers and income and credit-challenged households out of the so-called American Dream of home ownership.
Indeed, the housing inflation tsunami was by no means an equal opportunity benefactor. One study based on the Fed’s periodic survey of consumer finances, in fact, showed that between 2010 and 2020 upper income households, defined as those having an average income of $180,000, saw their collective housing investments rise from $4.5 trillion to $10.3 trillion. That was a 130% gain in just one decade!
By contrast, the housing investment value held by lower income households, defined as having an average income of $29,000, rose from $4.46 trillion to, well, $4.79 trillion. That’s a piddling gain of just 3.5%, which amounted to a double digit lost when you account for the 19% plus rise in the CPI during the same 10-year period.
Household Mortgage Debt and Mortgage % of Wage and Salary Income, 1971 to 2009
To be sure, the Fed heads were not explicitly trying to redistribute wealth to the top of the economic ladder, although that’s most surely what happened. Instead, the whole theory of interest rate repression was that it would stoke a higher level of spending and investment than would otherwise occur, and especially so in the residential housing sector.
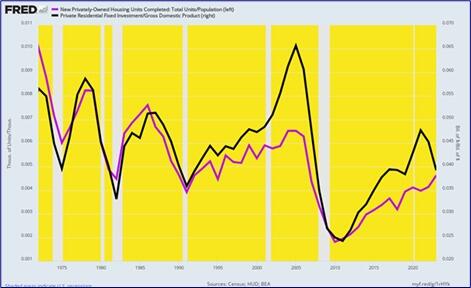
Needless to say, no cigar on that front. Residential housing completions per capita and residential housing investment as a % of GDP have been heading relentlessly southward every since Nixon rug-pulled the dollar’s anchor to gold and unleashed the Federal Reserve to foist monetary central planning on the main street economy.
As depicted by the black line, for instance, residential housing investment as a percent of GDP dropped from 5.7% in 1972 to just 3.9% in 2023. The only deviation from this steady downward trend was in 2003-2006, which is to say the very interval during which Bernanke’s first experiment with 1% money fueled the subprime mortgage and house price inflation disaster.
In fact, the chart below paired with the first one above with respect to nearly $50 trillion value of homeowner occupied real estate tells you all you need to know about the folly of Keynesian central banking. To wit, artificially cheap money does not stimulate higher levels of real output and income over time; it merely causes existing assets to be bid-up and inflated in the secondary markets.
Per Capita Private Housing Units Completed and Residential Investment % of GDP, 1972 to 2023
In turn, the systematic and relentless inflation of existing assets confers windfall gains and losses on the public in an entirely capricious manner but with the perverse effect of redistributing wealth to the top of the economic ladder. The Fed’s entire financial repression model is therefore not only pointless and ineffective—it’s profoundly iniquitous, too.
* * *
The truth is, we’re on the cusp of an economic crisis that could eclipse anything we’ve seen before. And most people won’t be prepared for what’s coming. That’s exactly why bestselling author Doug Casey and his team just released a free report with all the details on how to survive an economic collapse. Click here to download the PDF now.