Since 1990, the world population has grown by 3 billion people. And half of those births occurred in Asia.
But which countries have seen the most (relative) growth, and have any declined?
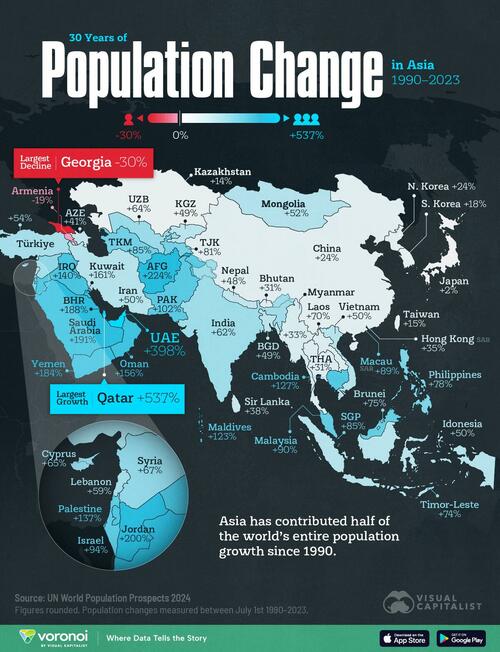
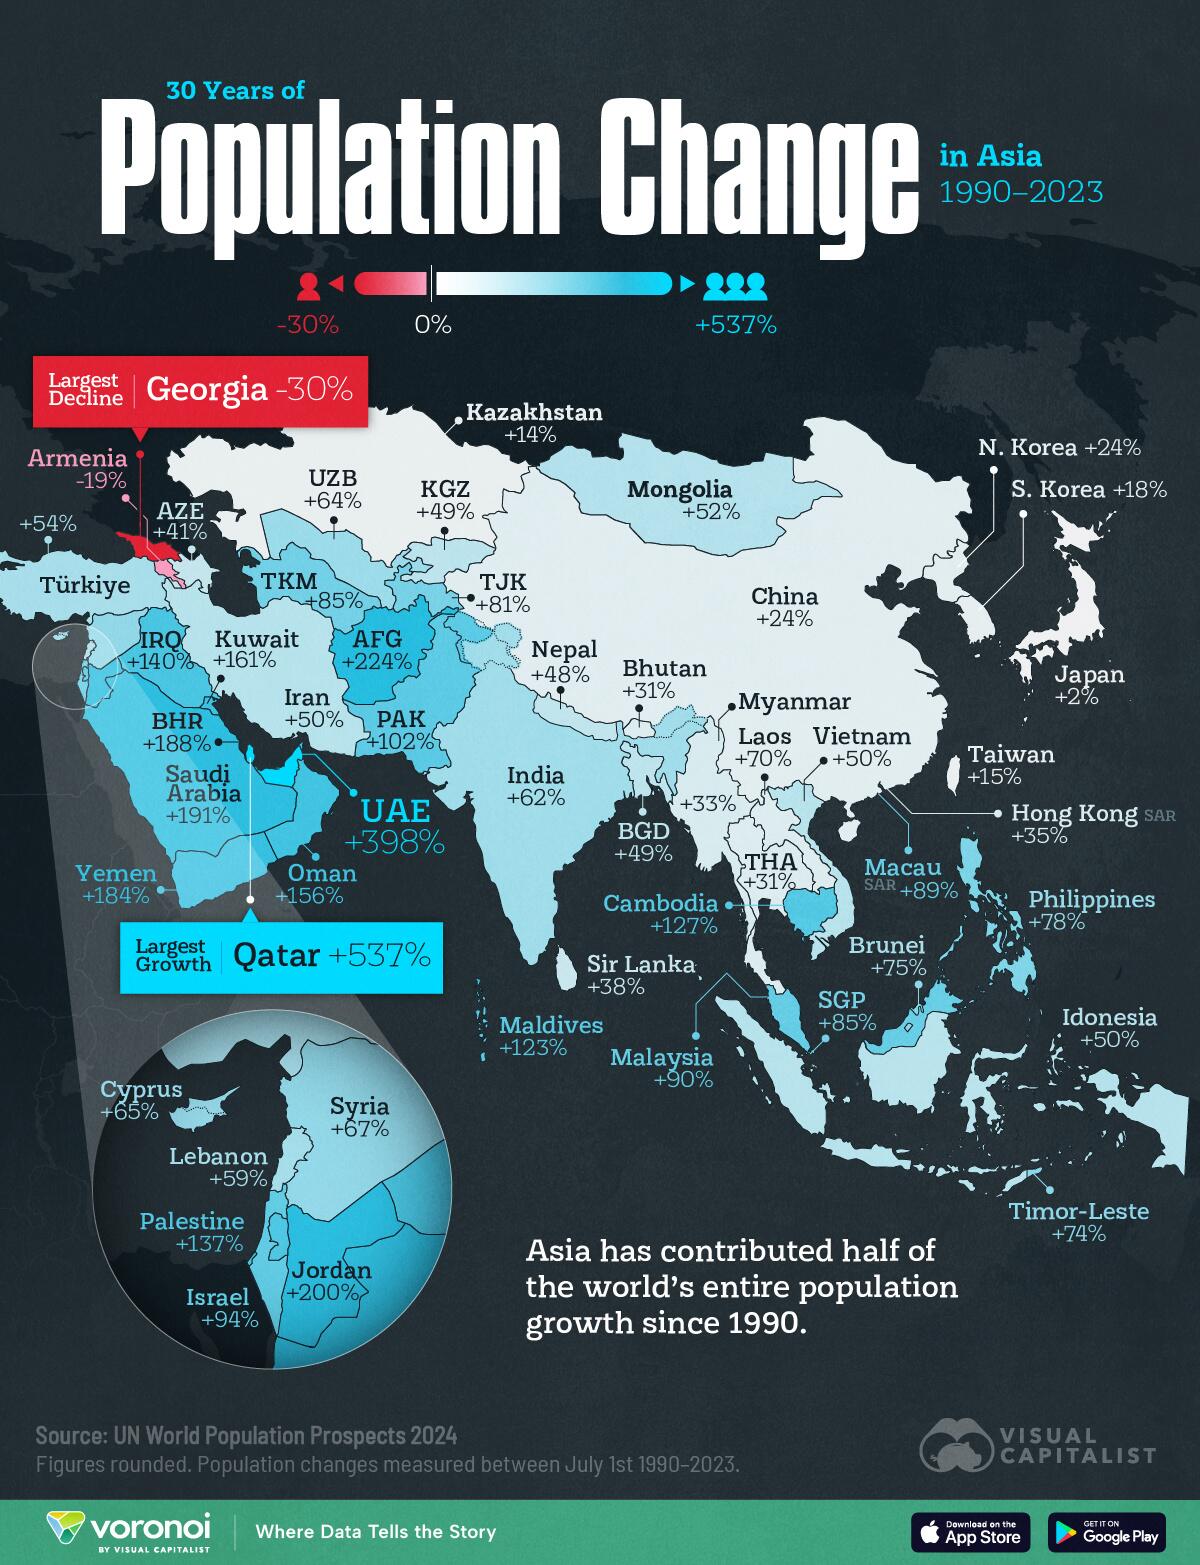
Visual Capitalist's Pallavi Rao maps out the changes in population for every Asian country between 1990 and 2023.
Data was sourced from the UN’s World Population Prospects 2024, and all figures are rounded.
Ranked: Asian Countries by Population Change (1990–2023)
The Middle East has seen the largest relative population growth in Asia, in some cases up 3-6x as seen in Qatar, UAE, Saudi Arabia.
| Rank | Country | % Change (1990–2023) |
2023 Population (Thousands) |
|---|---|---|---|
| 1 | �� Qatar | 537 | 2,979 |
| 2 | �� UAE | 398 | 10,642 |
| 3 | �� Afghanistan | 224 | 41,455 |
| 4 | �� Jordan | 200 | 11,439 |
| 5 | �� Saudi Arabia | 191 | 33,264 |
| 6 | �� Bahrain | 188 | 1,570 |
| 7 | �� Yemen | 184 | 39,391 |
| 8 | �� Kuwait | 161 | 4,839 |
| 9 | �� Oman | 156 | 5,049 |
| 10 | �� Iraq | 140 | 45,074 |
| 11 | �� Palestine | 137 | 5,409 |
| 12 | �� Cambodia | 127 | 17,424 |
| 13 | �� Maldives | 123 | 526 |
| 14 | �� Pakistan | 102 | 247,504 |
| 15 | �� Israel | 94 | 9,256 |
| 16 | �� Malaysia | 90 | 35,126 |
| 17 | �� Macao | 89 | 714 |
| 18 | �� Singapore | 85 | 5,789 |
| 19 | �� Turkmenistan | 85 | 7,364 |
| 20 | �� Tajikistan | 81 | 10,390 |
| 21 | �� Philippines | 78 | 114,891 |
| 22 | �� Brunei | 75 | 459 |
| 23 | �� Timor-Leste | 74 | 1,384 |
| 24 | �� Laos | 70 | 7,665 |
| 25 | �� Syria | 67 | 23,595 |
| 26 | �� Cyprus | 65 | 1,345 |
| 27 | �� Uzbekistan | 64 | 35,652 |
| 28 | �� India | 62 | 1,438,070 |
| 29 | �� Lebanon | 59 | 5,773 |
| 30 | �� Türkiye | 54 | 87,271 |
| 31 | �� Mongolia | 52 | 3,432 |
| 32 | �� Iran | 50 | 90,609 |
| 33 | �� Indonesia | 50 | 281,190 |
| 34 | �� Vietnam | 50 | 100,352 |
| 35 | �� Kyrgyzstan | 49 | 7,074 |
| 36 | �� Bangladesh | 49 | 171,467 |
| 37 | �� Nepal | 48 | 29,695 |
| 38 | �� Azerbaijan | 41 | 10,318 |
| 39 | �� Sri Lanka | 38 | 22,972 |
| 40 | �� Hong Kong | 35 | 7,443 |
| 41 | �� Myanmar | 33 | 54,134 |
| 42 | �� Thailand | 31 | 71,702 |
| 43 | �� Bhutan | 31 | 786 |
| 44 | �� North Korea | 24 | 26,418 |
| 45 | �� China | 24 | 1,422,585 |
| 46 | �� South Korea | 18 | 51,749 |
| 47 | �� Taiwan | 15 | 23,317 |
| 48 | �� Kazakhstan | 14 | 20,330 |
| 49 | �� Japan | 2 | 124,371 |
| 50 | �� Armenia | -19 | 2,943 |
| 51 | �� Georgia | -30 | 3,807 |
On the whole, nearly all Asian countries have added significantly to their people in the last three decades, including some of the world’s most populous countries: India (+62%), China (+24%), Indonesia (+50%), and Pakistan (+102%).
Only two transcontinental countries—Armenia and Georgia—have seen population declines. War is a primary reason for both, leading to economic repercussions, in turn fuelling an exodus of people.
Chasing Demographic Dividends
This explosion in people has also fueled Asia’s economic growth, particularly in China and India, from surging demand for goods and services.
In fact, Asia now has the highest share of world GDP (36%), eclipsing North America (31%) by five percentage points.
At the same time, many parts of the continent are still struggling with food insecurity, poverty, and civil strife. And for many of its advanced economies, the demographic dividend is ending. As birth rates fall, and the population ages, social security nets may not be able to keep up with increasing demands.
Wondering what this map looks like for other regions in the world? Check out Mapped: Population Change in the Americas (1990–2023) for a similar breakdown.