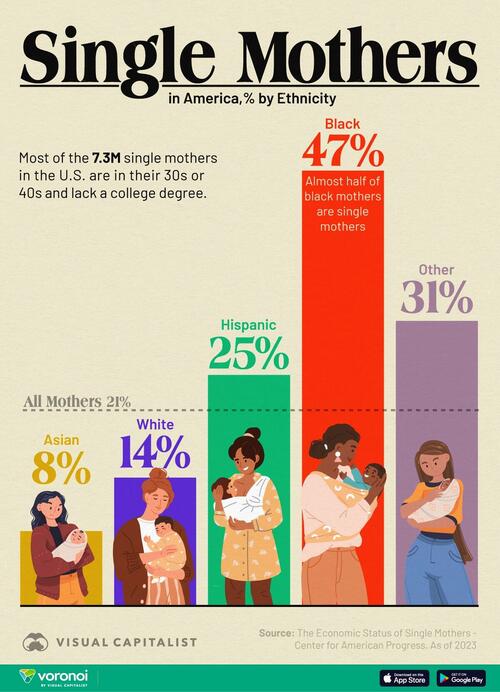
There are 7.3 million single mothers in the U.S., as well as 1.9 million single fathers. Single parents often face the dual challenge of being both the primary breadwinners and caregivers for their families.
This graphic, via Visual Capitalist's Bruno Venditti, represents the percentage of mothers in the U.S. who are single, by race/ethnicity, in 2023.

The data comes from the Center for American Progress.
21% of All Mothers Are Single
In 2023, single-mother families accounted for 1 in 5 families with children under 18.
-
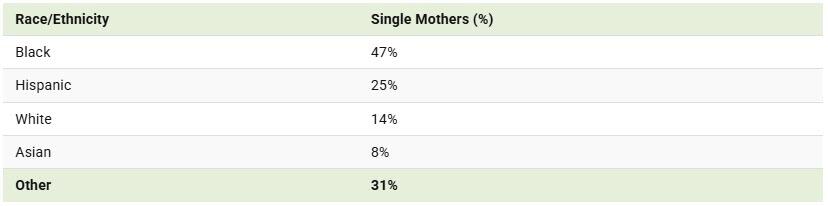
47% of Black mothers were single mothers.
-
25% of Hispanic mothers were single mothers.
The majority of single mothers are in their 30s or 40s and do not have a college degree. Overall, single mothers face a 28% poverty rate.
Changes in Family Structure Over Time
According to the Center for American Progress, family structures in the U.S. have changed significantly over the past five decades.
-
In 1970, 67% of adults (ages 25 to 49) lived with a spouse and at least one child.
-
By 2021, that number had dropped to 37%.
Marriage rates have also declined:
-
In 1970, 69% of adults were married, compared to 50% in 2021.
-
Meanwhile, the percentage of adults who have never been married rose from 17% to 31% over the same period.
If you enjoyed this topic, check out this graphic that shows the distribution of wealth in the United States from 1990 to 2023 by generation.