Average weekly working hours typically see a decline during recessions, as employers seek to cut payroll costs during these periods by reducing hours.
However, in recent years, weekly hours have seen a consistent decline despite the U.S. being outside of a recession.
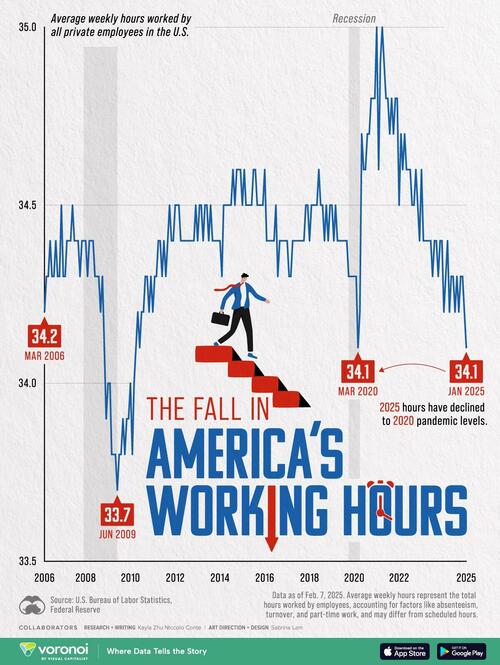
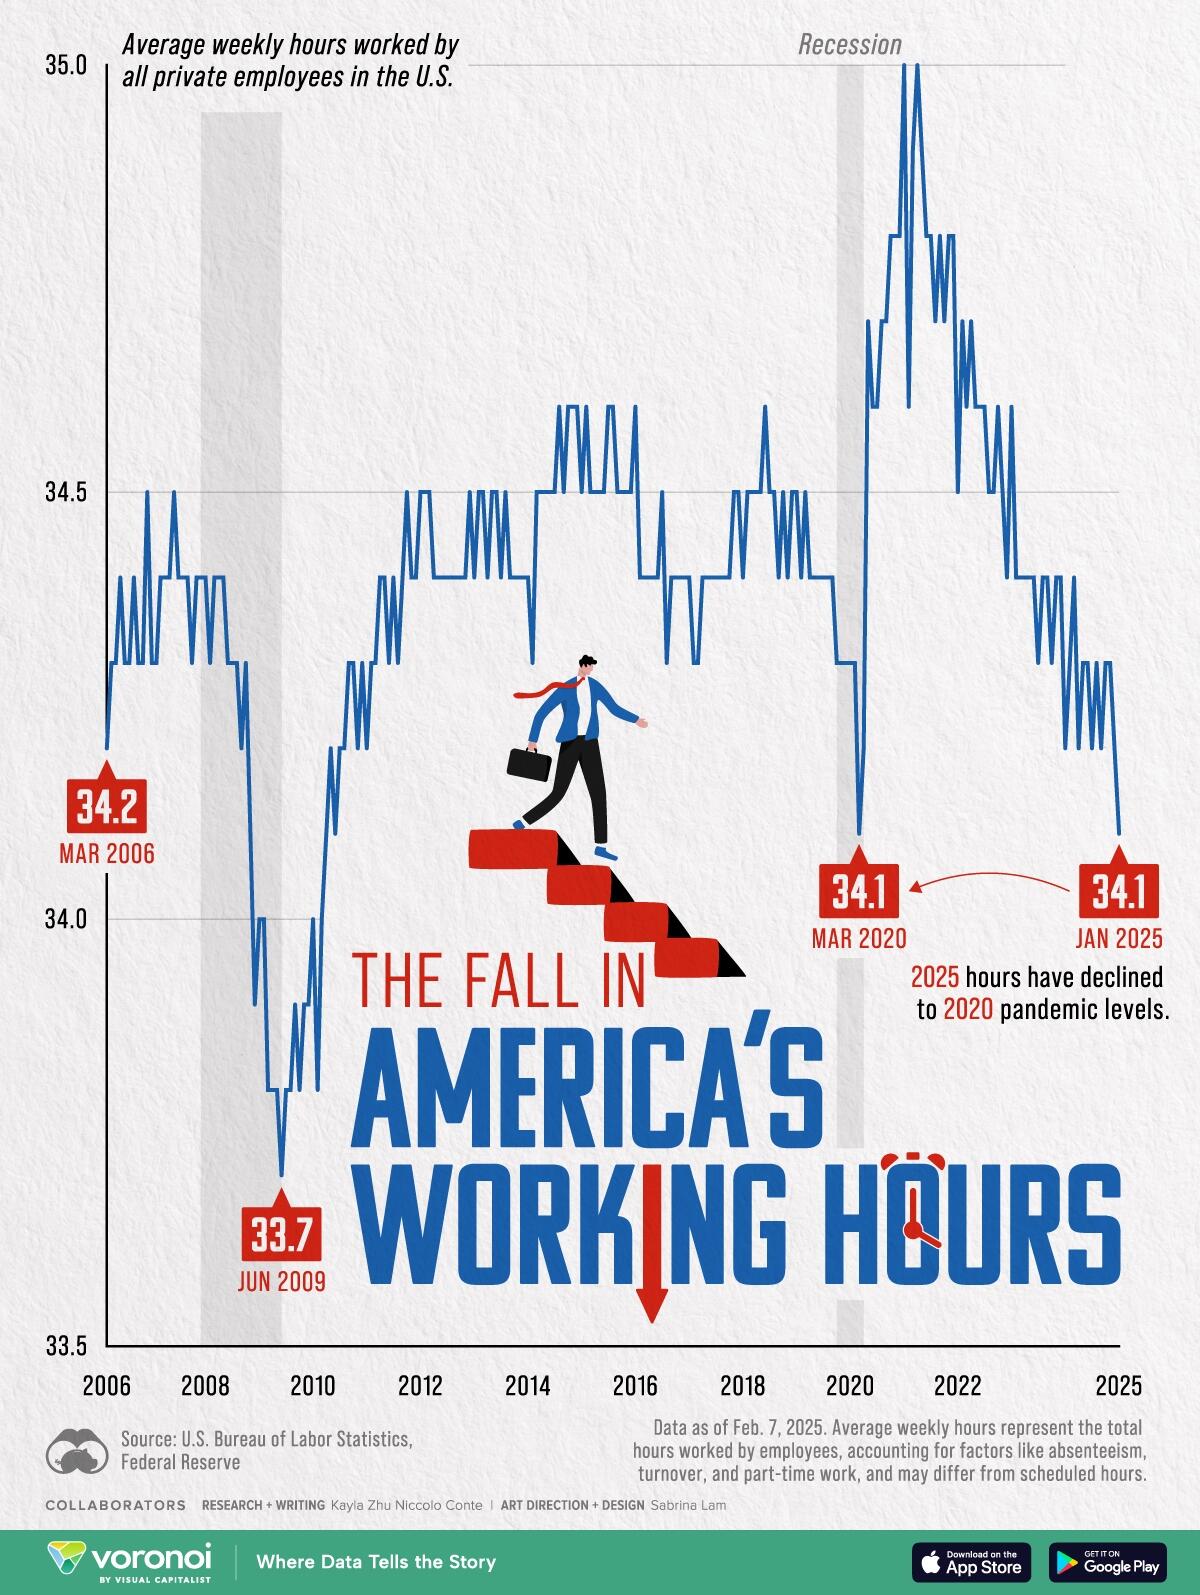
This graphic, via Visual Capitalist's Kayla Zhu, visualizes the average weekly hours worked by all private employees in the U.S.
The data comes from the U.S. Bureau of Labor Statistics (BLS) via the Federal Reserve and is updated as of Feb. 7, 2025.
Average weekly hours represent the total hours worked by employees for which pay was received, accounting for factors like unpaid absenteeism, turnover, and part-time work, and may differ from scheduled hours.
Below, we show the average weekly hours worked for all U.S. private employees from 2006 to early 2025.
| Date | Average weekly hours worked for all U.S. private employees |
|---|---|
| 2006-03-01 | 34.2 |
| 2006-09-01 | 34.4 |
| 2007-03-01 | 34.4 |
| 2007-09-01 | 34.4 |
| 2008-03-01 | 34.4 |
| 2008-09-01 | 34.2 |
| 2009-03-01 | 33.8 |
| 2009-09-01 | 33.9 |
| 2010-03-01 | 34 |
| 2010-09-01 | 34.3 |
| 2011-03-01 | 34.3 |
| 2011-09-01 | 34.4 |
| 2012-03-01 | 34.5 |
| 2012-09-01 | 34.4 |
| 2013-03-01 | 34.5 |
| 2013-09-01 | 34.4 |
| 2014-03-01 | 34.5 |
| 2014-09-01 | 34.5 |
| 2015-03-01 | 34.5 |
| 2015-09-01 | 34.5 |
| 2016-03-01 | 34.4 |
| 2016-09-01 | 34.4 |
| 2017-03-01 | 34.3 |
| 2017-09-01 | 34.4 |
| 2018-03-01 | 34.5 |
| 2018-09-01 | 34.4 |
| 2019-03-01 | 34.5 |
| 2019-09-01 | 34.4 |
| 2020-03-01 | 34.1 |
| 2020-09-01 | 34.7 |
| 2021-03-01 | 34.9 |
| 2021-09-01 | 34.8 |
| 2022-03-01 | 34.6 |
| 2022-09-01 | 34.5 |
| 2023-03-01 | 34.4 |
| 2023-09-01 | 34.4 |
| 2024-03-01 | 34.4 |
| 2024-09-01 | 34.2 |
| 2025-01-01 | 34.1 |
The average number of weekly hours worked in the U.S. in 2025 has dropped to levels seen during the 2020 pandemic, signaling potential weakness in labor demand.
This decline follows a steady decrease from a peak in 2021.
Sectors Driving the Trend
The BLS attributes this decline to reductions in the retail trade and leisure and hospitality industries, which have faced weaker demand, influenced by shifting consumer behavior post-pandemic, including a decline in in-person shopping and dining.
Despite employment gains since the pandemic low, both these sectors remain below or barely above pre-2020 employment levels, signaling ongoing weakness.
Both these sectors also have trended towards hiring more part-time employees, further contributing to lower weekly hours.
However, the BLS noted that while retail trade and leisure and hospitality saw the greatest recent declines in average weekly hours worked, there has been a broader trend toward slightly reduced average weekly hours across most industries in the United States.
The number of hours worked typically declines during recessions, as seen in both the Great Recession (2008–2009) and the COVID-19 recession (2020). However, the decline during the pandemic was more abrupt and short-lived.
To compare average working hours across the world, check out this graphic that visualizes the average weekly number of hours worked per employee by country.