from PIL import Image
from transformers import AutoModelForCausalLM, AutoTokenizer, AutoProcessor
from starvector.data.util import process_and_rasterize_svg
import torch

# Load the model
model_name = "starvector/starvector-8b-im2svg"

starvector = AutoModelForCausalLM.from_pretrained(model_name, torch_dtype=torch.float16, trust_remote_code=True)
processor = starvector.model.processor
tokenizer = starvector.model.svg_transformer.tokenizer

# Move model to GPU and set to evaluation mode
starvector.cuda()
starvector.eval()

# Load and process the input image
image_pil = Image.open('assets/examples/sample-18.png')

image = processor(image_pil, return_tensors="pt")['pixel_values'].cuda()
if not image.shape[0] == 1:
    image = image.squeeze(0)
batch = {"image": image}

# Generate SVG from the image
raw_svg = starvector.generate_im2svg(batch, max_length=4000)[0]
svg, raster_image = process_and_rasterize_svg(raw_svg)
The code above demonstrates how to load a pre-trained StarVector model using the Transformers library, process an input image, and generate SVG code. The model handles all the complexity of understanding the visual elements and translating them into structured vector graphics code.
Note: To use image rasterization features, you need to install the starvector library. Visit the StarVector repository for installation instructions and to ensure all dependencies are properly installed.
We provide Hugging Face 🤗 model checkpoints for image2SVG vectorization, for 💫 StarVector-8B and 💫 StarVector-1B. These are the results on SVG-Bench, using the DinoScore metric.
| Method | SVG-Stack | SVG-Fonts | SVG-Icons | SVG-Emoji | SVG-Diagrams |
|---|---|---|---|---|---|
| AutoTrace | 0.942 | 0.954 | 0.946 | 0.975 | 0.874 |
| Potrace | 0.898 | 0.967 | 0.972 | 0.882 | 0.875 |
| VTracer | 0.954 | 0.964 | 0.940 | 0.981 | 0.882 |
| Im2Vec | 0.692 | 0.733 | 0.754 | 0.732 | - |
| LIVE | 0.934 | 0.956 | 0.959 | 0.969 | 0.870 |
| DiffVG | 0.810 | 0.821 | 0.952 | 0.814 | 0.822 |
| GPT-4-V | 0.852 | 0.842 | 0.848 | 0.850 | - |
| 💫 StarVector-1B | 0.926 | 0.978 | 0.975 | 0.929 | 0.943 |
| 💫 StarVector-8B | 0.966 | 0.982 | 0.984 | 0.981 | 0.959 |
Note: StarVector models will not work for natural images or illustrations, as they have not been trained on those images. They excel in vectorizing icons, logotypes, technical diagrams, graphs, and charts.
As shown in the table above, StarVector-8B achieves the highest performance across all benchmark datasets, demonstrating its effectiveness in generating high-quality SVG code from images. The model's ability to understand and reproduce complex vector graphics makes it particularly valuable for applications requiring precise vectorization of icons, logos, and technical diagrams.
SVG-Bench is a benchmark for evaluating SVG generation models. It contains 10 datasets, and 3 tasks: Image-to-SVG, Text-to-SVG, and Diagram-to-SVG. The benchmark provides a standardized way to assess the performance of different approaches to SVG generation, enabling fair comparisons and driving progress in the field.
See our Huggingface 🤗 Dataset Collection
| Dataset | Train | Val | Test | Token Length | SVG Primitives | Annotation |
|---|---|---|---|---|---|---|
| SVG-Stack 🤗 | 2.1M | 108k | 5.7k | 1,822 ± 1,808 | All | Captions |
| SVG-Stack_sim 🤗 | 601k | 30.1k | 1.5k | 2k ± 918 | Vector path | - |
| SVG-Diagrams 🤗 | - | - | 472 | 3,486 ± 1,918 | All | - |
| SVG-Fonts 🤗 | 1.8M | 91.5k | 4.8k | 2,121 ± 1,868 | Vector path | Font letter |
| SVG-Fonts_sim 🤗 | 1.4M | 71.7k | 3.7k | 1,722 ± 723 | Vector path | Font letter |
| SVG-Emoji 🤗 | 8.7k | 667 | 668 | 2,551 ± 1,805 | All | - |
| SVG-Emoji_sim 🤗 | 580 | 57 | 96 | 2,448 ± 1,026 | Vector Path | - |
| SVG-Icons 🤗 | 80.4k | 6.2k | 2.4k | 2,449 ± 1,543 | Vector path | - |
| SVG-Icons_sim 🤗 | 80,435 | 2,836 | 1,277 | 2,005 ± 824 | Vector path | - |
| SVG-FIGR 🤗 | 270k | 27k | 3k | 5,342 ± 2,345 | Vector path | Class, Caption |
We offer a summary of statistics about the datasets used in our training and evaluation experiments. These datasets are included in SVG-Bench. The subscript _sim_ stands for the simplified version of the dataset, as required by some baselines.
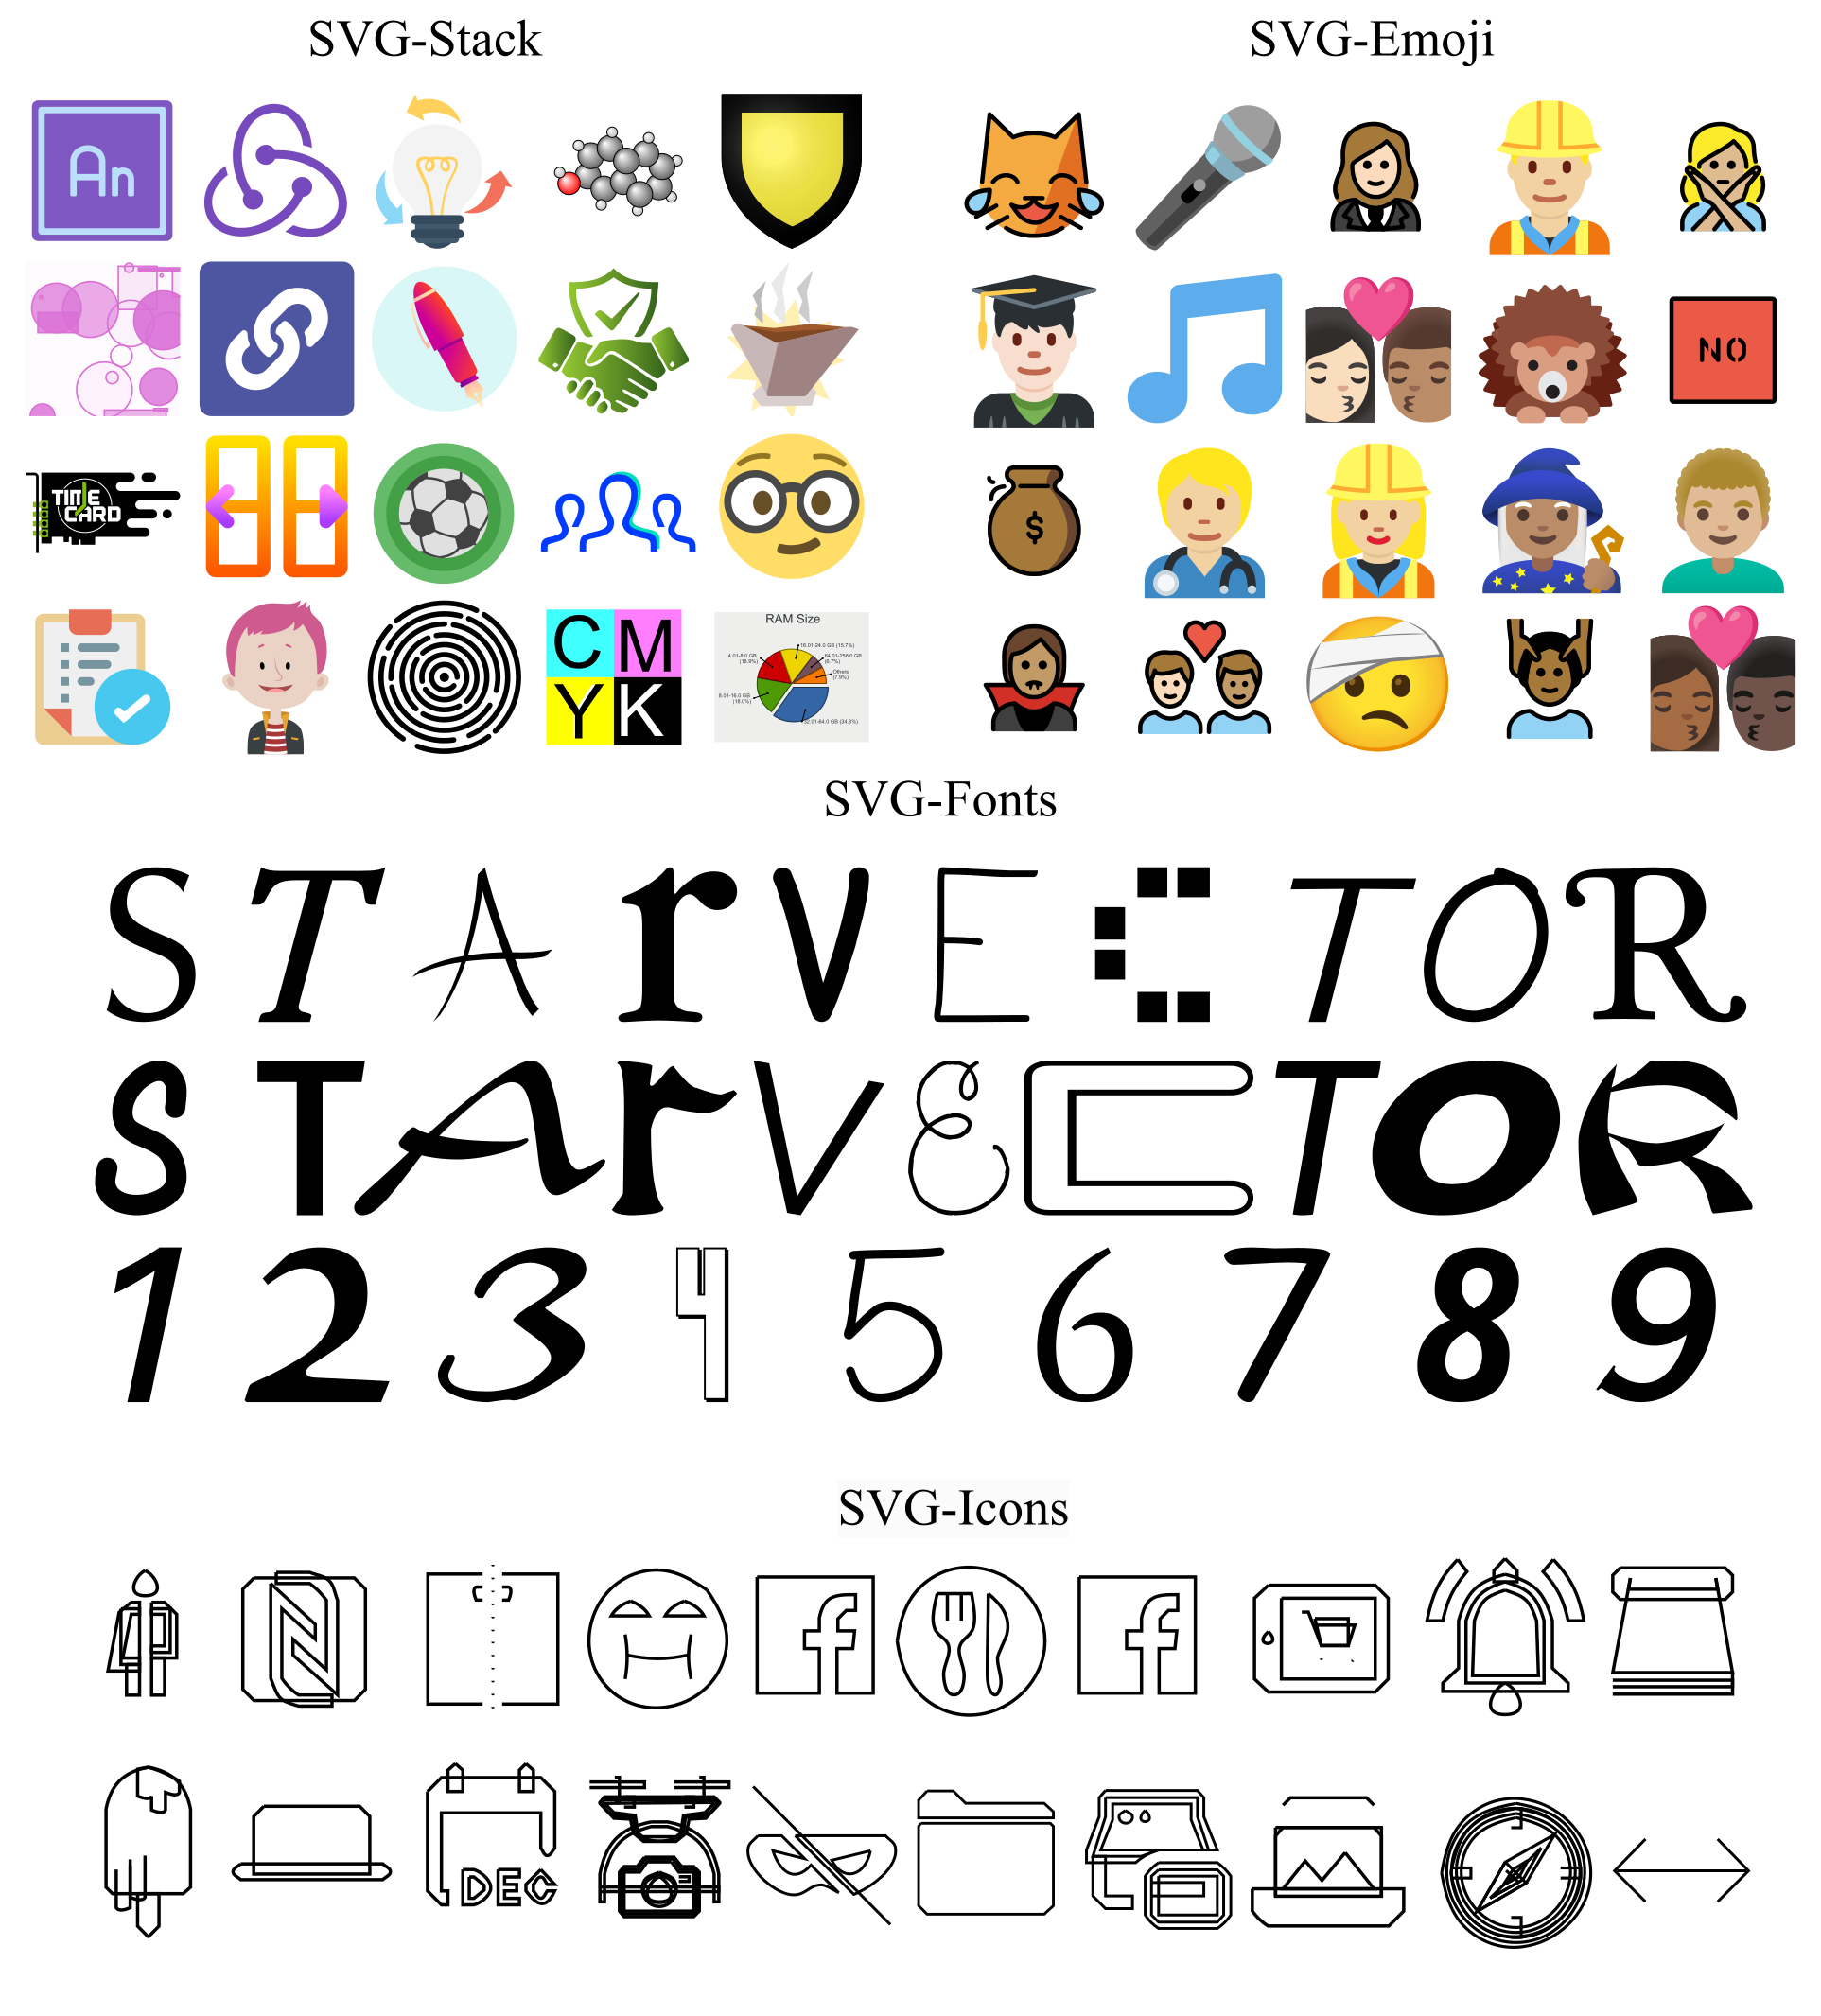
Datasets Examples

The diversity and scale of these datasets enable StarVector to learn a wide range of SVG generation capabilities, from simple icons to complex diagrams. By training on this comprehensive collection, the model develops a robust understanding of vector graphics principles and can generalize to new, unseen examples.
The following examples demonstrate StarVector's superior performance in generating high-quality SVG code from various input images. These comparisons highlight the model's ability to capture fine details and structural elements that other methods often miss.


Key observations: StarVector consistently produces cleaner, more accurate SVG representations compared to traditional vectorization methods. The model's ability to understand semantic content enables it to make intelligent decisions about which details to preserve and how to structure the resulting SVG code.
These qualitative results demonstrate that StarVector not only achieves higher numerical scores on benchmark metrics but also produces visually superior results that better capture the intent and structure of the original images. This is particularly evident in complex cases like technical diagrams and detailed icons, where traditional methods often struggle to maintain coherence and accuracy.