
Credit cards play a crucial role in U.S. consumer finance, with 74 percent of adults having at least one. They serve as the main method of payment for most individuals, accounting for 70 percent of retail spending. They are also the primary source of unsecured borrowing, with 60 percent of accounts carrying a balance from one month to the next. Surprisingly, credit card interest rates are very high, averaging 23 percent annually in 2023. Indeed, their rates are far higher than the rates on any other major type of loan or bond. Why are credit card rates so high? In our recent research paper, we address this question using granular account-level data on 330 million monthly credit card accounts.
Credit Card Interest Rates
The vast majority of credit cards have variable rates, where the quoted annual percentage rate (APR) is a fixed spread over the federal funds rate (FFR). Therefore, to understand credit card pricing, our analysis focuses on the effective interest rate spread (effective APR-FFR). Importantly, this spread is determined at account origination and typically remains unchanged throughout the account’s lifetime—a norm since the passage of the Credit Card Accountability Responsibility and Disclosure (CARD) Act of 2009. This means that in setting the interest spread on a card at the time of origination, banks must price in the account’s default risk over its entire lifetime. To capture this, we track the return to lending to accounts over their lifetime by grouping them into portfolios based on their credit score at origination. This novel approach allows us to conduct a comprehensive analysis of the returns to credit card lending.
Based on our analysis of the Y-14M data reported by banks, we find that the interest rate spread is high across all FICO scores. Over our sample, the average interest spread is 14.5 percent, and ranges from 21 percent for borrowers with a low FICO score of 600, to 7.22 percent for those with the highest score of 850. It is striking that the spread exceeds 7 percent for even the lowest credit-risk borrowers (see the chart, “Credit Card Interest Rate Spread by FICO at Origination,” below). We investigate four hypotheses of the factors driving these high spreads. Each is under its own heading below.
Credit Card Interest Rate Spread by FICO at Origination
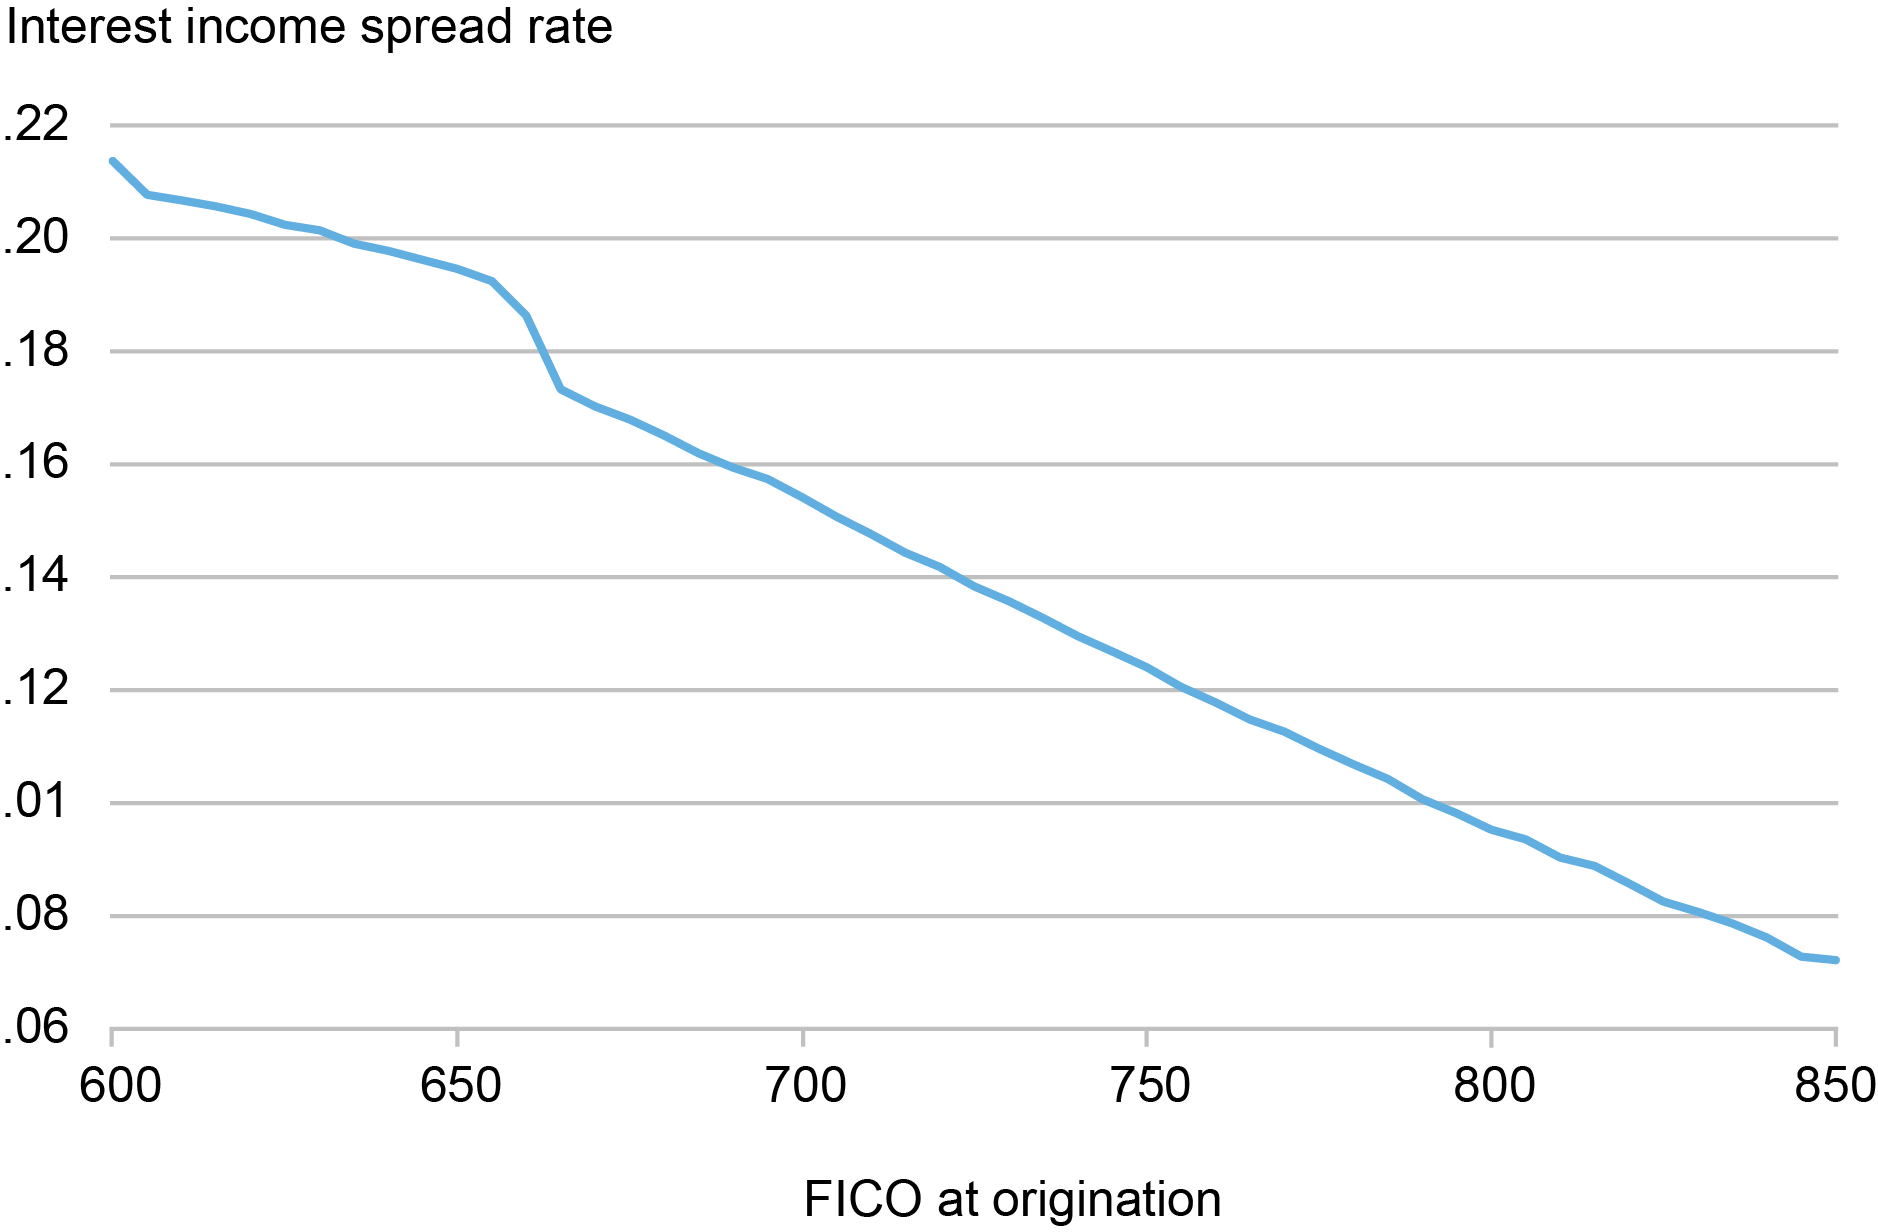
Notes: This chart shows the average effective interest rate spread paid by borrowing accounts within each FICO score bin at origination minus the fed funds rate. The sample is restricted to observations where the account is classified as a borrower, which is defined as an account that either revolves a balance or is charged off in a given month. The effective interest rate spread is calculated as the reported finance charge divided by the borrower’s Average Daily Balance (ADB) then subtracting the federal funds rate. All rates are annualized. Average is weighted by ADB of borrowers in a FICO bin.
High Interest Rates to Compensate for Default Losses?
Credit card lending is unsecured, exposing banks to significant risk of credit losses. On average, 53 percent of banks’ annual default losses are due to credit card lending. Our first hypothesis posits that the high credit card interest spreads are compensation for expected default losses. To test this, we compare the interest rate spreads to net charge-off rates (net of recoveries) for credit card accounts. We find that net charge-off rates are indeed high—reaching 9.3 percent annually for borrowers with a low FICO score of 600 at origination and decreasing to 1.3 percent for those with a score of 850. However, the net charge-off rates cannot explain most of the interest spread: on average, credit card borrowers pay a spread of 8.8 percent over their average default losses.
High Interest Rates to Recoup High Reward Expenses?
Many credit cards offer rewards to incentivize usage, providing cash, airline miles, or points that can be redeemed for various benefits. These rewards, typically a percentage of purchase volume, have become a significant expense for banks. In 2023 alone, the six largest card banks spent a staggering $67.9 billion on rewards. This leads to our second hypothesis: High interest rates are necessary to recoup the high cost of rewards. However, our analysis shows this is not the case. Rewards expenses are more than fully covered by banks’ interchange income—fees collected from merchants based on purchase volume. On average, interchange income amounts to 1.82 percent of purchase volume, while rewards expenses are 1.57 percent.
Operating Costs and Market Power
The third hypothesis is that high interest rates stem from credit card banks having pricing power given their retail-oriented business. Our findings support this hypothesis and suggest that credit card banks incur large costs to attain this pricing power.
We find that credit card operations have exceptionally high operating expenses—4-5 percent of dollar balances annually. These costs account for about half of default-adjusted APR spreads (interest rate spreads minus net charge-off rates).
Marketing costs are a major component of these expenses. Credit card banks spend an average of 1‑2 percent of assets annually on marketing—10 times the proportion spent by other banks. Consequently, the largest credit card banks rank among the world’s top marketers, with budgets comparable to consumer giants like Nike and Coca-Cola.
Moreover, we show that banks with higher operating expenses charge substantially higher interest spreads to their borrowers for a given FICO score (see chart below) and earn substantially higher gross margins. This suggests that credit card banks have significant pricing power, which they attain by incurring large operating expenses.
Interest Spread and Operating Expenses
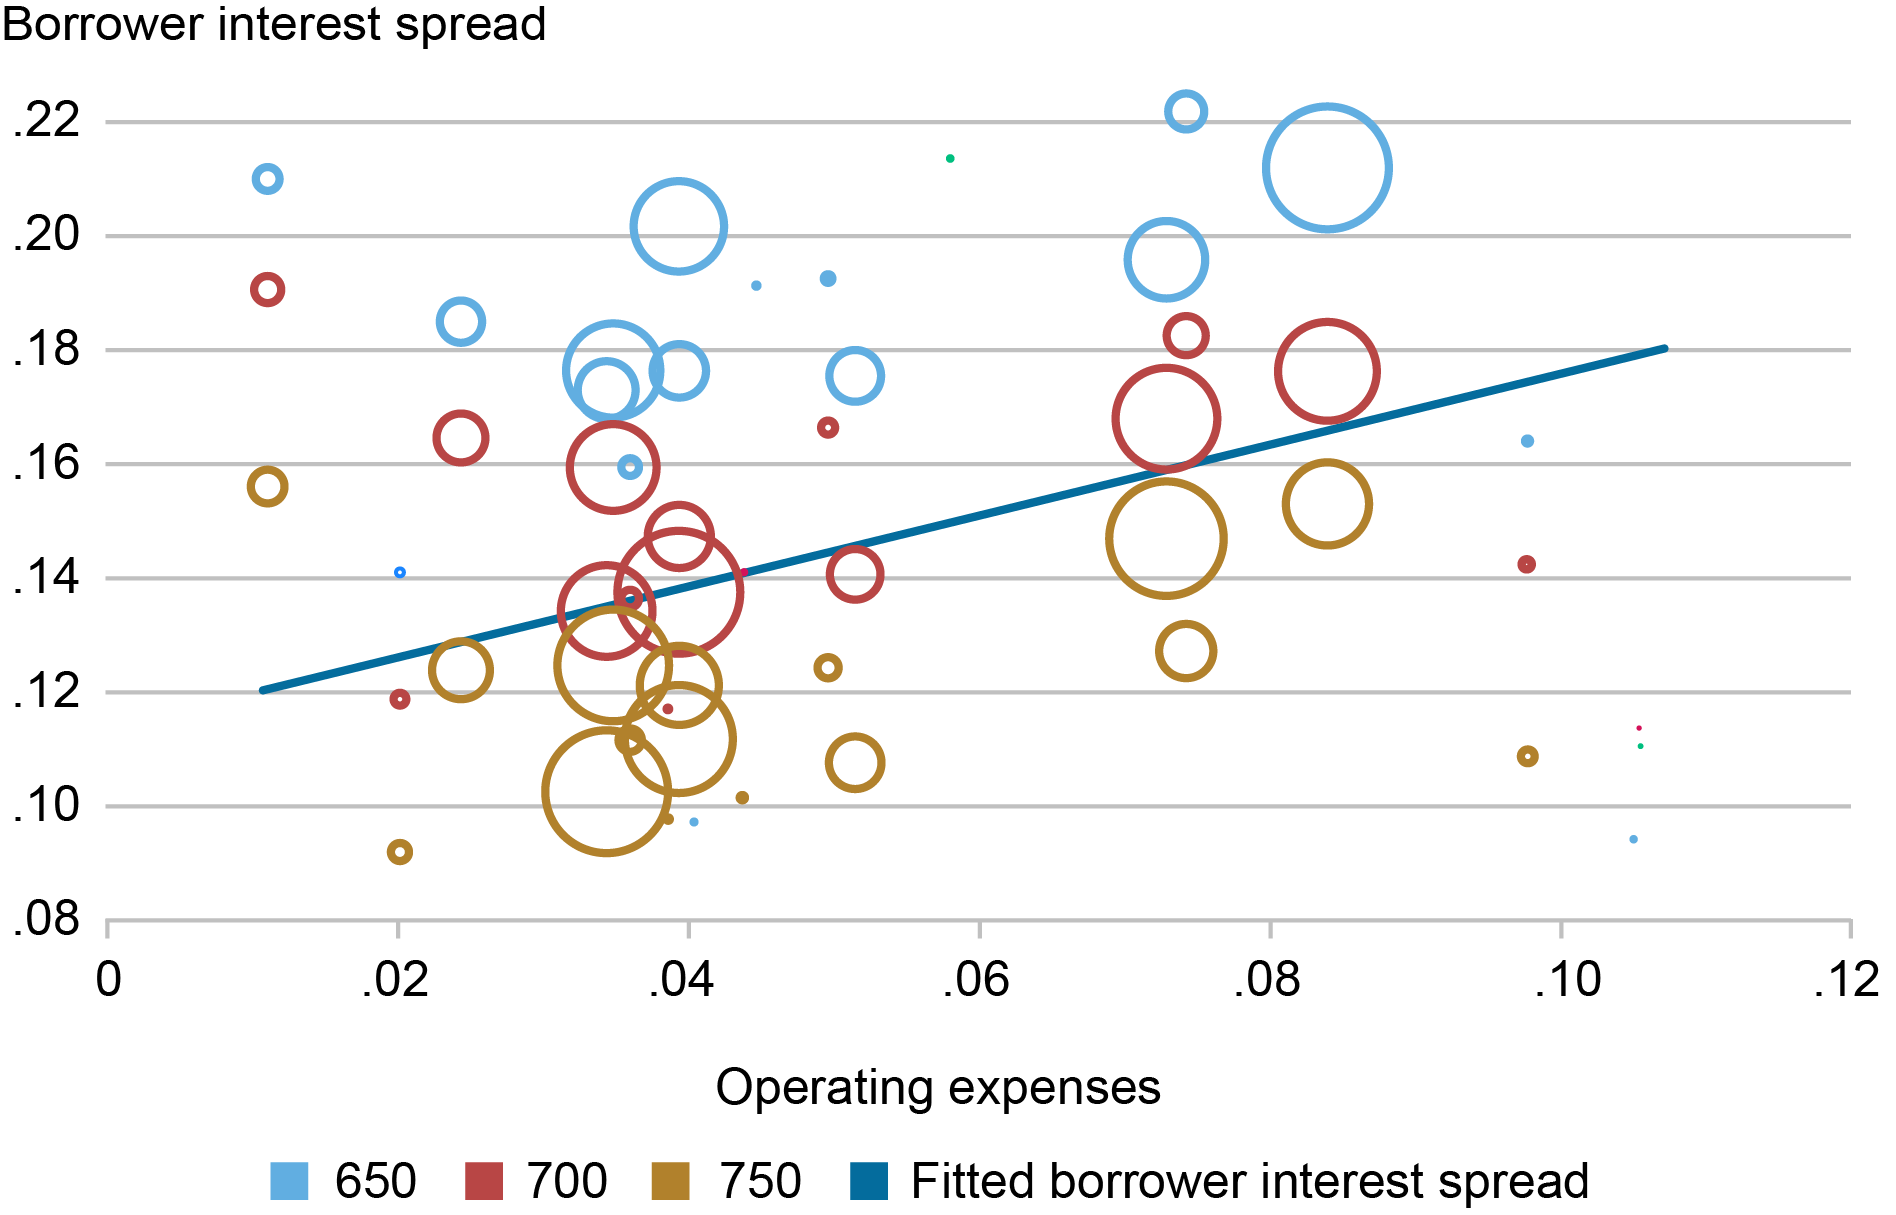
Notes: This chart presents a scatter plot of borrowers’ interest spreads against bank-level operating expense rates, with separate data points for portfolios originating at FICO scores of 650 (light blue), 700 (red), and 750 (gold). Borrower interest spread is calculated as total finance charges minus interest expenses across all borrower observations within a bank-origination FICO bin, divided by the total borrower Average Daily Balance (ADB) in that bin. Operating expense rate is the total operating expense divided by the total cycle-ending balance, measured at the bank-month level and averaged over the sample period. The size of each bubble represents the relative total borrower ADB within its origination FICO bin. The dark blue fitted line is from regressing borrower’s interest spread rate on the operating expense rate with origination FICO fixed effect. The regression is weighted using borrower’s ADB as analytic weights.
Non-Diversifiable Default Risk in Bad Times
The fourth hypothesis is that credit card rates price in a large default risk premium, because credit card default risk is undiversifiable, and the default losses are high during economic downturns. Our findings also support this hypothesis.
We show that the return on assets (ROA) earned by credit card banks—after accounting for all income and expenses—strongly decreases in accounts’ FICO scores (see chart below). This suggests that credit card rates price in a default risk premium.
Return on Assets by FICO Score at Origination
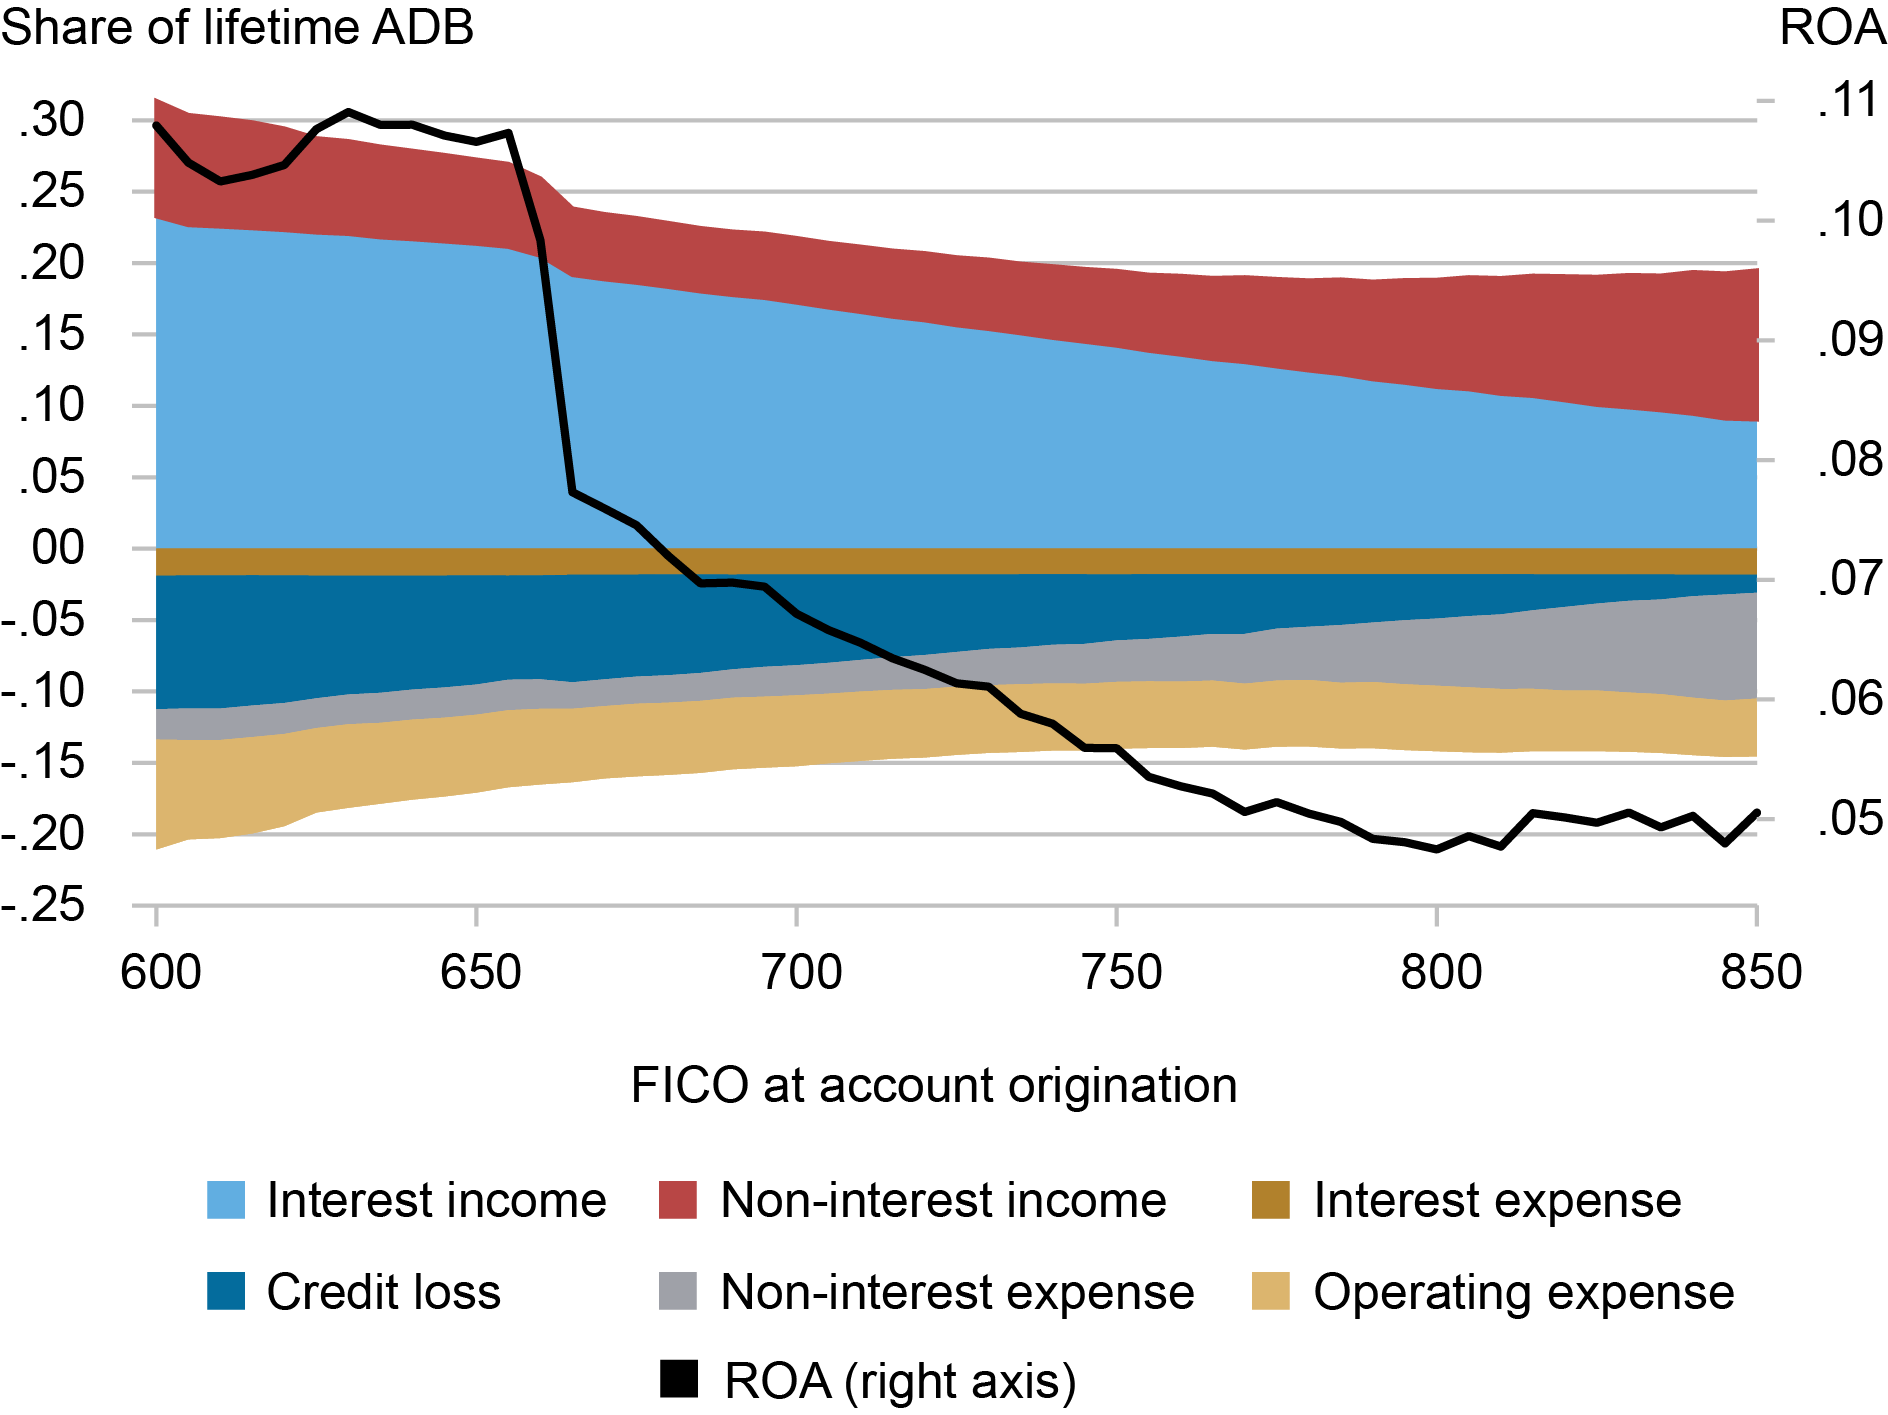
Notes: This chart presents all income and expense components (all on the left y-axis) along with return on assets (ROA) (on the right y-axis) for borrowers, grouped by FICO scores at account origination. Income is plotted as a positive quantity, while losses and expenses are negative. For each origination FICO bin, we compute the cumulative lifetime dollar amount of each component across all accounts in the bin over the entire sample period, then divide it by their cumulative Average Daily Balance (ADB). ROA (net margin) is defined as interest spread minus net charge-offs, plus net interchange income (interchange minus rewards), plus the fee income rate, minus the operating expense rate and other non-operating expenses. All rates are annualized.
Additionally, we find that charge-offs across different FICO score portfolios tend to move together, increasing during economic downturns. This co-movement suggests that charge-off risk has a common component that cannot be diversified within the credit card market.
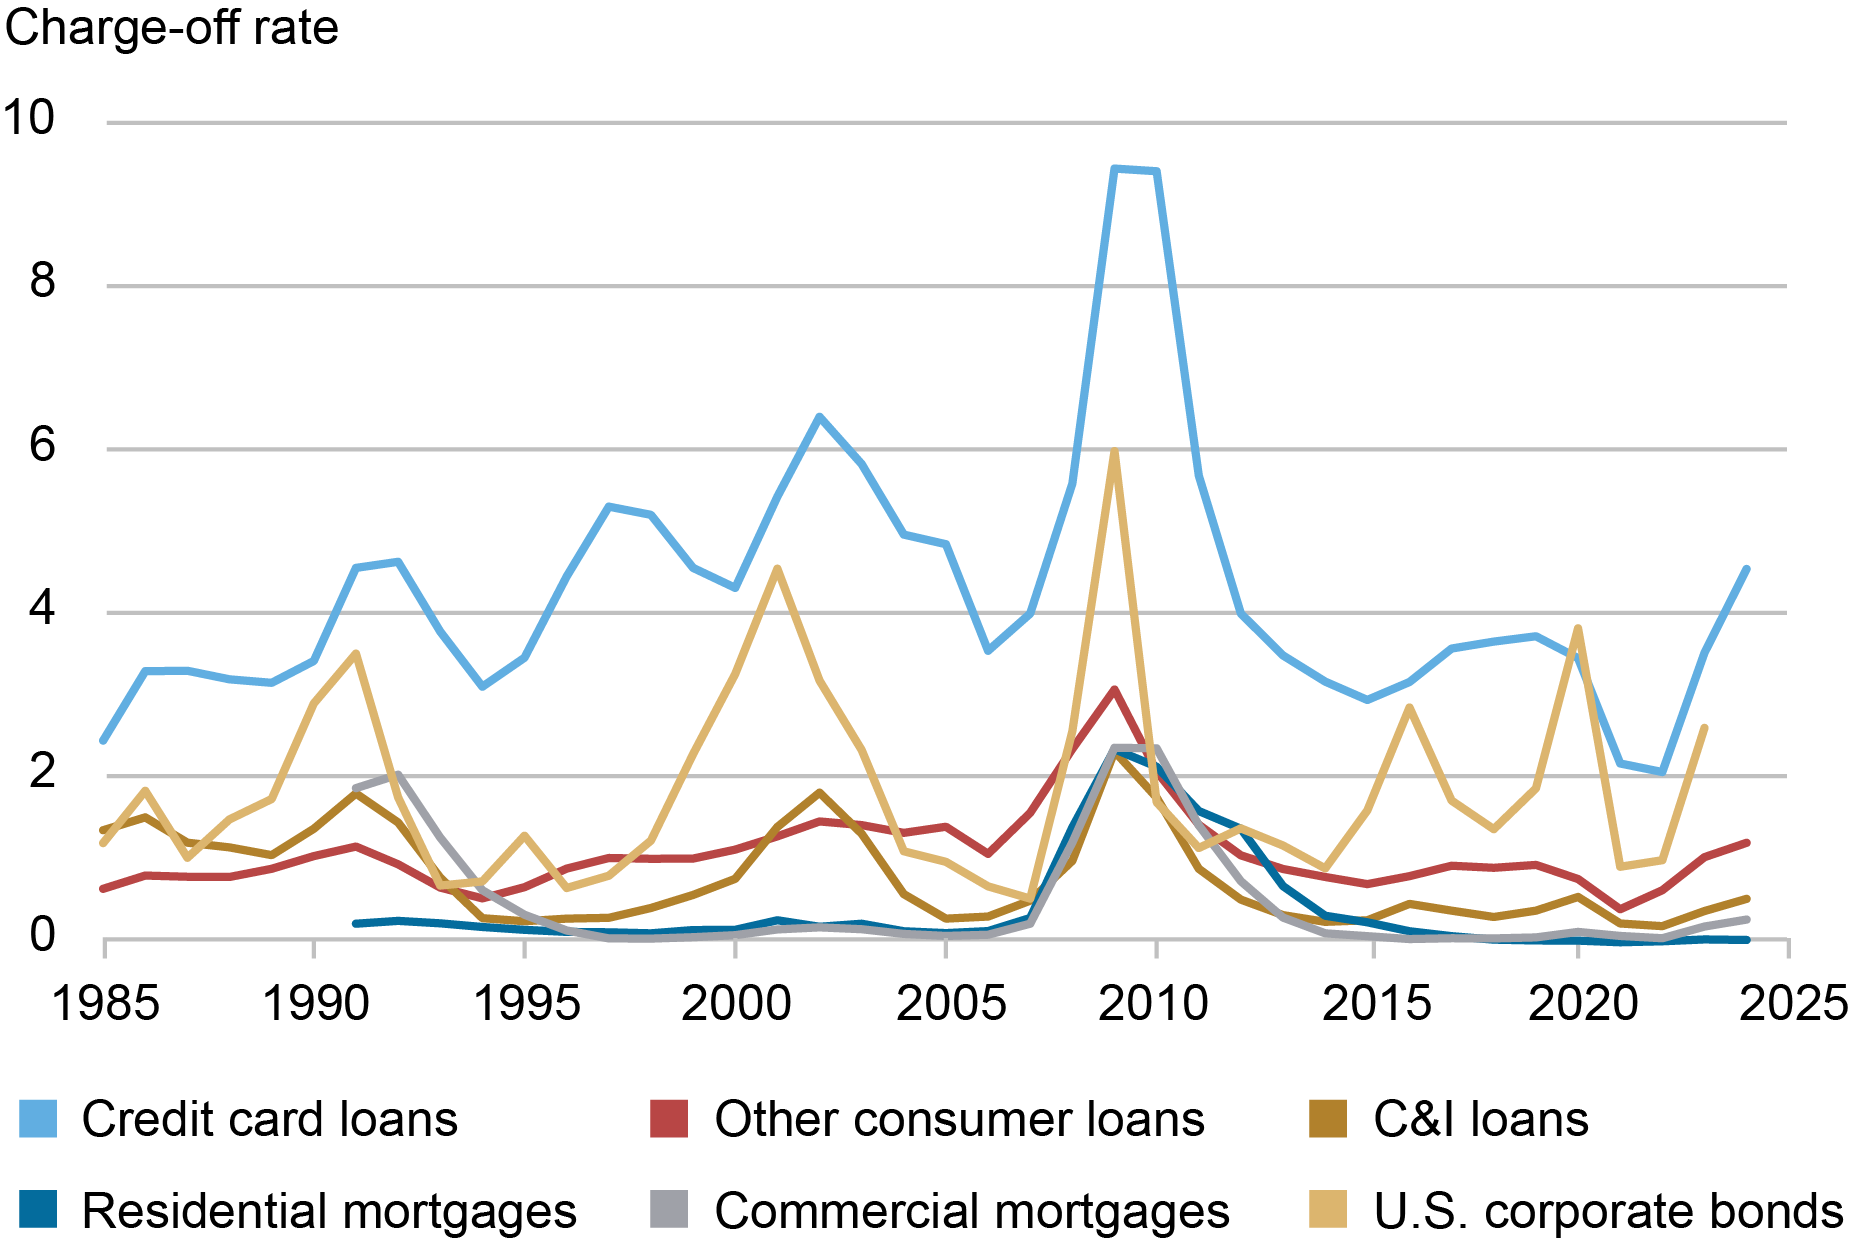
Moreover, credit card charge-off rates are highly correlated with default rates on banks’ other loans as well as on corporate bonds (see chart below). This further underscores that default risk of credit card lending is undiversifiable across other lending markets and therefore requires compensation for risk.
Charge-off Rates and Default Rates on Various Loans and Corporate Bonds
(a) Bank Loans
(b) Credit Cards and Corporate Bonds
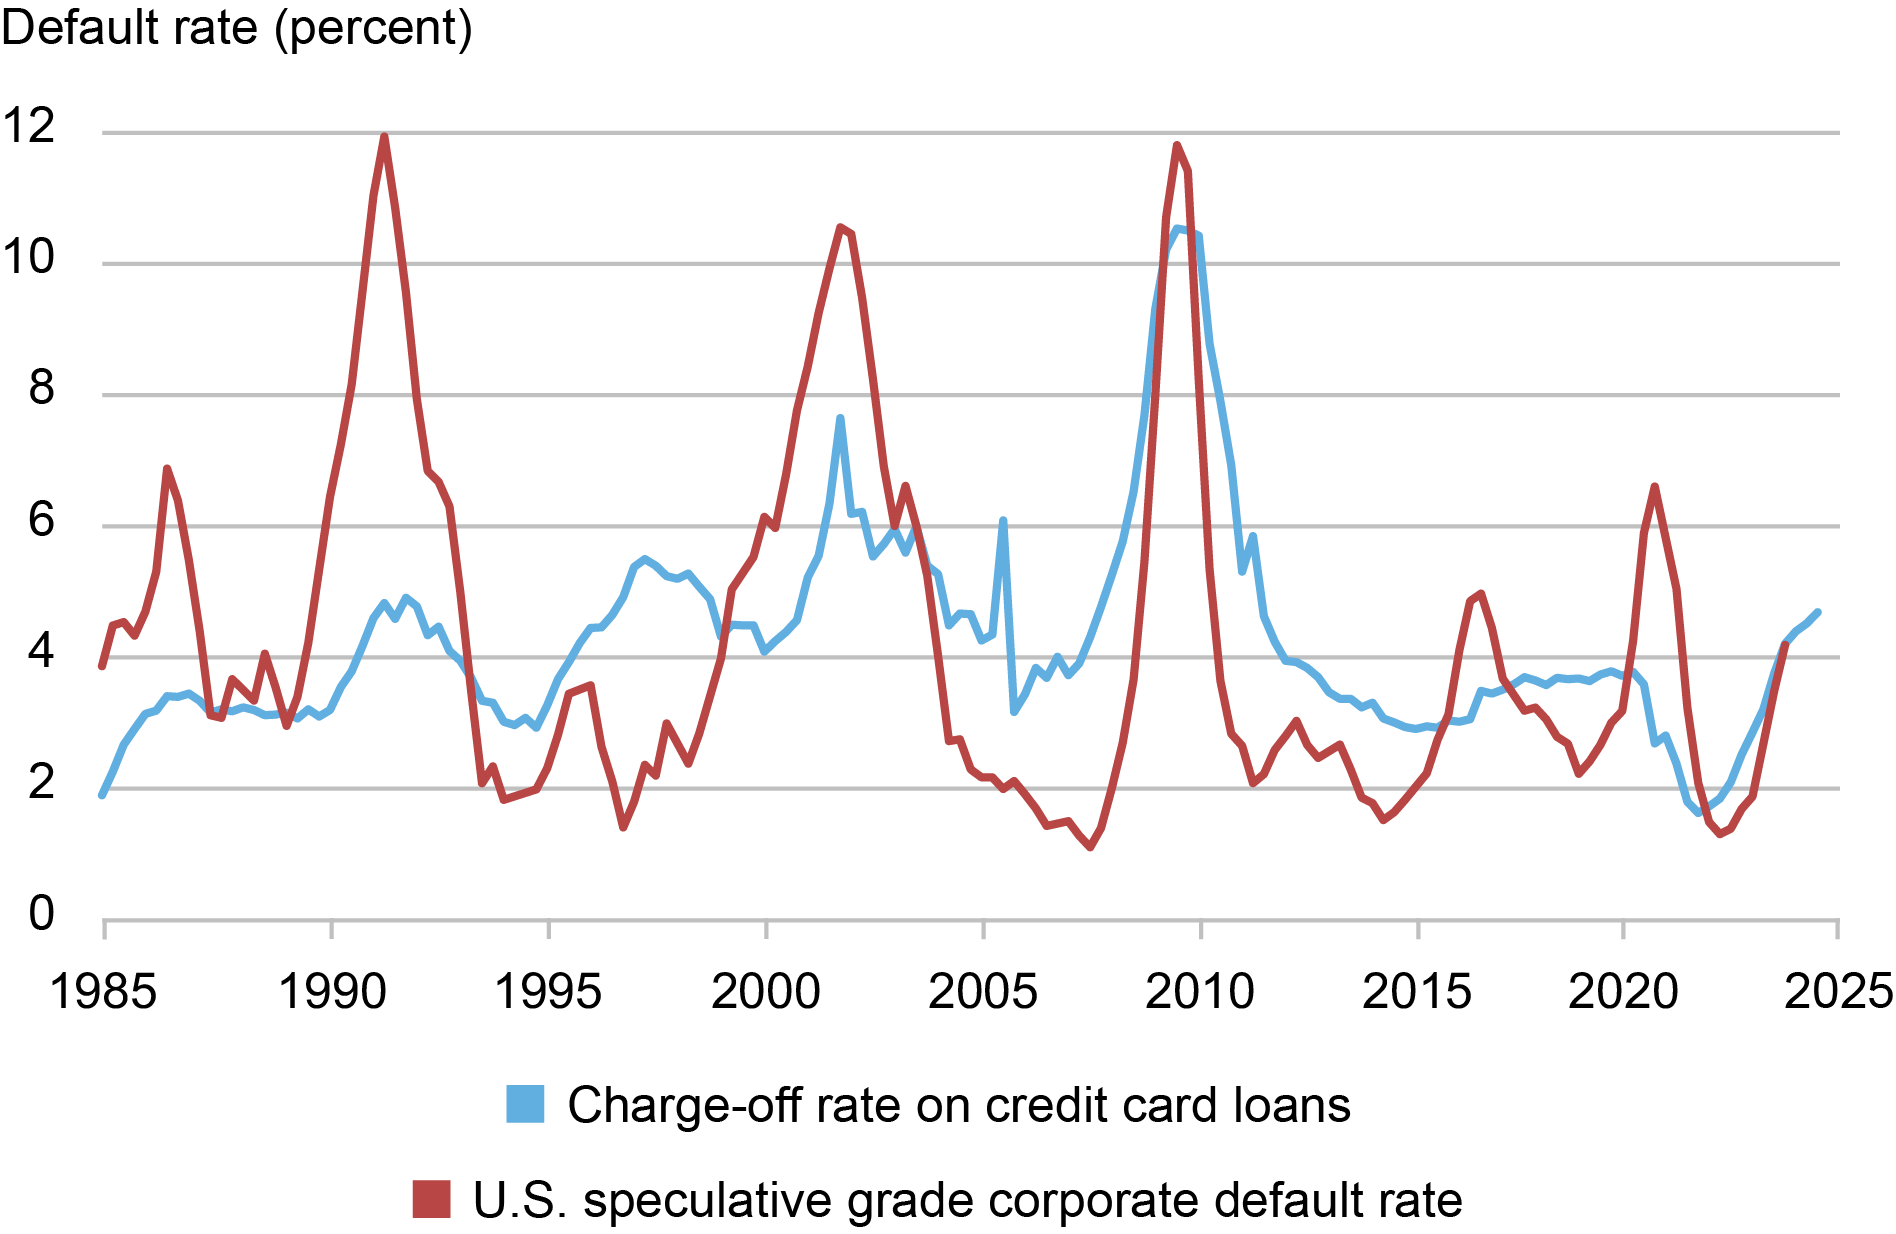
Notes: This chart presents the time series of charge-off rates for various types of loans and corporate bonds. Panel (a) displays the net charge-off rates for credit cards, other consumer loans, commercial and industrial (C&I) loans, single-family residential mortgages, and commercial real estate loans, sourced from FRED. The U.S. corporate bond default rate is obtained from Standard & Poor’s (S&P), which reports the number of issuers that defaulted in a given period divided by the total number of issuers at the beginning of that period. We assume 40 percent recovery rate for U.S. corporate bonds. Panel (b) highlights the comparison between the U.S. speculative-grade corporate bond default rate and the credit card charge-off rate.
Estimating the Default Risk Premium
We formally test the default risk premium hypothesis using the standard factor-risk pricing approach of Fama and MacBeth (1973). To measure systemic default risk, we track monthly changes in the charge-off rate for the overall credit card lending market. Then, we estimate how sensitive different credit card FICO portfolios are to this risk by regressing their charge-off rate changes on the systemic default risk. The results in the chart below show that higher FICO portfolios have significantly lower exposure to default risk (lower beta) and the relationship is strongly linear.
Charge-off Rate and Betas Across FICO Scores at Origination
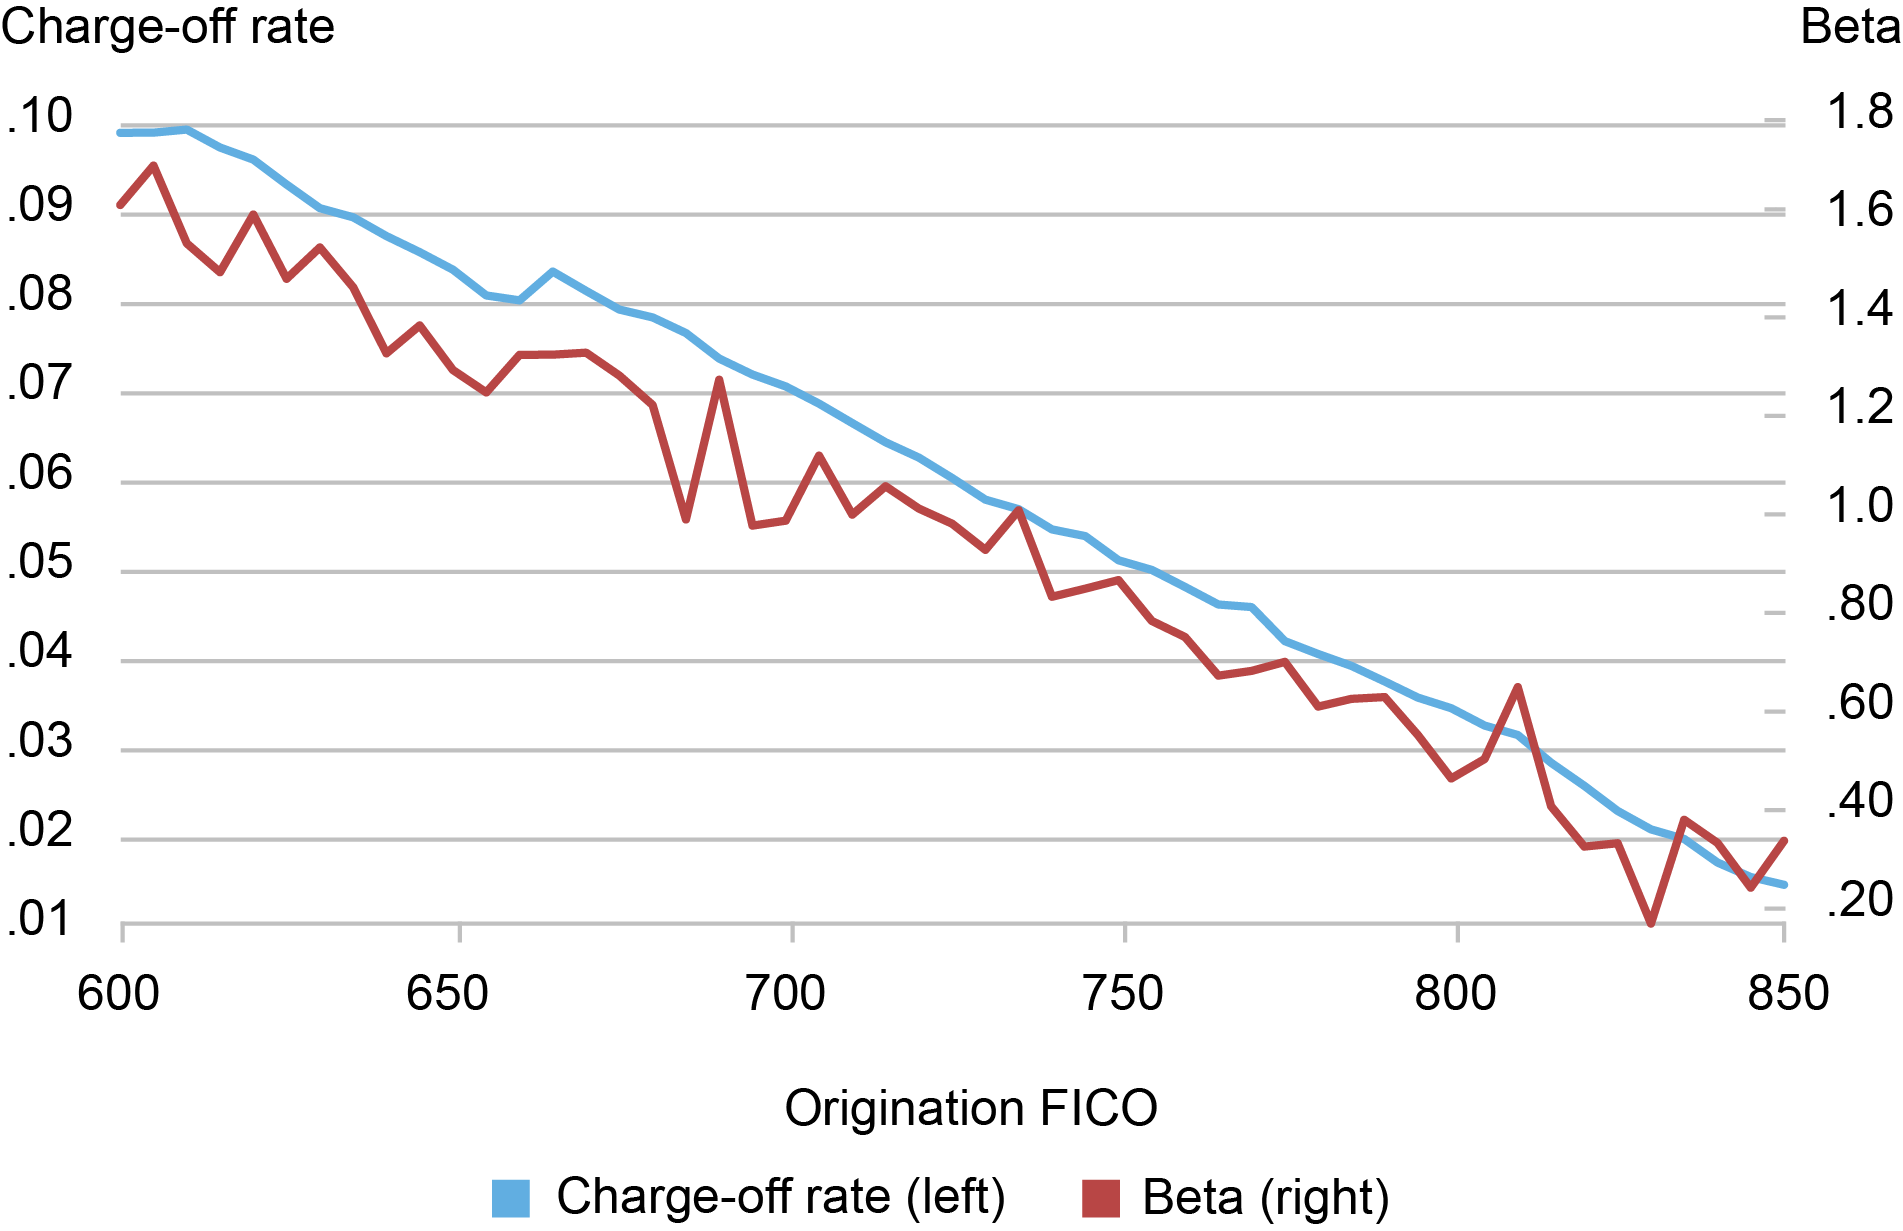
Notes: This chart plots the estimates of the risk exposure, beta, for each origination FICO bin (red line, right y-axis) and their actual charge-off rate (blue line, left y-axis). For each FICO bin, we estimate its beta to systematic default risk by regressing the change in its monthly charge-off rate on the change in the charge-off rate of the aggregate credit card portfolio.
Next, we estimate the compensation for exposure to the systemic default risk, that is, default risk premium, by regressing portfolios’ ROAs on their charge-off betas. The slope of this regression represents the default risk premium, and we find that charge-off beta carries a highly significant risk premium of 5.3 percent per year. Furthermore, the model’s fitted ROAs align closely with the actual ROAs across all FICO scores. This indicates that exposure to aggregate default risk can fully explain the relationship between ROA and FICO score shown above in the chart “Return on Assets by FICO Score at Origination.”
The regression intercept, estimated at 2.41 percent, represents the hypothetical return on lending to a borrower that has no systemic default risk. This closely aligns with the 2.57 percent ROA banks earn on transactors—accounts that pay balances in full each month and pose no default risk.
In our paper, we also compare the estimated risk premium to that in the corporate bond market. In addition, we provide an “alpha” estimate, quantifying how much higher the default-adjusted ROA of credit card lending is compared to the overall banking sector.
Concluding Remarks
Credit card interest rates are significantly higher than those of other major loan or bond products. While high default losses contribute, they do not fully explain the magnitude of card interest rates. Our findings suggest that the high rates reflect compensation for default risk that cannot be diversified away, either within the credit card market or across other lending markets in downturns. Additionally, our results indicate that credit card banks have significant pricing power, which they achieve by incurring large operating expenses.
Itamar Drechsler is a professor of finance at the Wharton School of the University of Pennsylvania.

Hyeyoon Jung is a financial research economist in the Federal Reserve Bank of New York’s Research and Statistics Group.
Weiyu Peng is a finance Ph.D. candidate at the Wharton School of the University of Pennsylvania.
Dominik Supera is an assistant professor of finance at the Columbia Business School.
Guanyu Zhou is a finance Ph.D. candidate at the Wharton School of the University of Pennsylvania.
How to cite this post:
Itamar Drechsler, Hyeyoon Jung, Weiyu Peng, Dominik Supera, and Guanyu Zhou, “Why Are Credit Card Rates So High?,” Federal Reserve Bank of New York Liberty Street Economics, March 31, 2025, https://libertystreeteconomics.newyorkfed.org/2025/03/why-are-credit-card-rates-so-high/.
Disclaimer
The views expressed in this post are those of the author(s) and do not necessarily reflect the position of the Federal Reserve Bank of New York or the Federal Reserve System. Any errors or omissions are the responsibility of the author(s).