Recently, I've been working on server-side projects using Cloudflare Workers with D1 database. During this process, I encountered several database-related challenges. Since databases are quite unfamiliar territory for frontend developers, I decided to document my experiences.
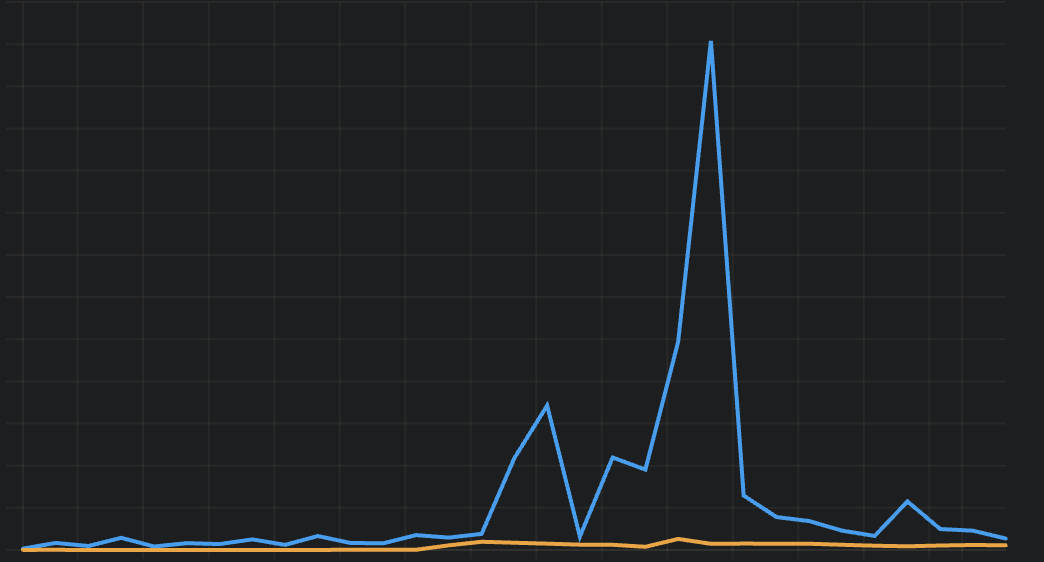
The image below shows the request records for the past 30 days, revealing dramatic fluctuations in database queries.
Solving problems begins with identifying them. Here are several methods that helped me spot issues:
- Monitoring the D1 dashboard to detect anomalies in database operations
- Examining query statements and row read/write counts, with special attention to queries with high counts or rows read/written
- Using
c.env.DB.prepare('<sql>').run()).metato check the returned metadata, which reveals how many rows were actually read/written for each query
It's important to understand that while Workers and D1 are both Cloudflare services, using them together doesn't make D1 faster. For example, a simple query like this has an average response time exceeding 200ms:
await db.select().from(user).limit(1)When an endpoint includes multiple database operations, it's best to use D1 batch operations, especially for write operations which are even slower than queries due to lack of read-only replicas. For instance, instead of:
await db.insert(user).values({...})
await db.insert(tweet).values({...})
Use batch operations:
await db.batch([
  db.insert(user).values({...}),
  db.insert(tweet).values({...})
])
This approach requires only a single REST request to D1 to complete multiple database write operations.
Note 1: Prisma doesn't support D1 batch operations, which led me to switch to Drizzle. Note 2: Be cautious when using batch for multiple queries, particularly when tables have columns with identical names.
When updating records, it's important to exclude the ID field (even if it remains unchanged). Consider this code:
await db.update(user).set(userParam).where(eq(user.id, userParam.id))The actual SQL executed:
update "User" set "id" = ?, "screenName" = ?, "updatedAt" = ? where "User"."id" = ?If this ID is referenced by foreign keys in other tables, it can lead to a massive number of row reads. For example, if a "tweet" table has a userId field referencing this ID and contains 1,000 records, updating the user with the ID included will cause 2,005 rows to be read instead of just 1.
The solution is to explicitly exclude the ID field from updates:
const r = await db
  .update(user)
  .set(omit(userParam, ['id']))
  .where(eq(user.id, userParam.id))
This properly limits rows read to 1, regardless of how many related records exist.
I noticed an SQL statement ranking high in rows read on the D1 dashboard:
SELECT count(id) as num_rows FROM "User";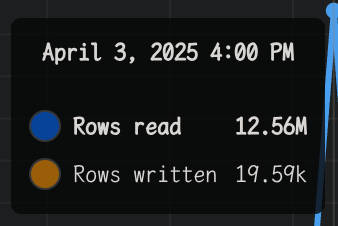
This led to a significant increase in rows read, so I implemented cursor-based pagination instead of offset-based pagination, and never provided total counts, since counting records scans all rows even with indexed IDs. This is a known issue with D1.
I discovered that a specific SQL query was causing hundreds of thousands of row reads:
SELECT "modlist"."id",
       "modlist"."updatedat",
       "modlistsubscription"."action",
       Json_group_array(DISTINCT "modlistuser"."twitteruserid"),
       Json_group_array(DISTINCT "modlistrule"."rule")
FROM   "modlist"
       LEFT JOIN "modlistsubscription"
              ON "modlist"."id" = "modlistsubscription"."modlistid"
       LEFT JOIN "modlistuser"
              ON "modlist"."id" = "modlistuser"."modlistid"
       LEFT JOIN "modlistrule"
              ON "modlist"."id" = "modlistrule"."modlistid"
WHERE  "modlist"."id" IN ( ?, ? )
GROUP  BY "modlist"."id",
          "modlistsubscription"."action";
This query joined four tables, potentially causing a "Cartesian product explosion." If both modListUser and modListRule tables contain 100 records each, a simple join could yield 10,000 results, which is not the expected behavior.
The solution was to split queries and handle grouping and transformation in the application logic:
await db.batch([
  db
    .select({
      modListId: modListUser.modListId,
      twitterUserId: modListUser.twitterUserId,
    })
    .from(modListUser)
    .where(eq(modListUser.modListId, 'modlist-1')),
  db
    .select({
      modListId: modListRule.modListId,
      rule: modListRule.rule,
    })
    .from(modListRule)
    .where(eq(modListRule.modListId, 'modlist-1')),
]) // 200 rows read instead of 10,101For bulk inserts, instead of using:
await Promise.all(users.map((it) => db.insert(user).values(it)) as any)Or even:
await db.batch(users.map((it) => db.insert(user).values(it)) as any)I found it more efficient to insert multiple records in a single statement:
await db.insert(user).values(users)However, SQLite and D1 limit the number of bound parameters to 100 per query. With 10 columns, we can insert at most 10 rows per SQL statement. For larger batches, we need to chunk the data:
await db.batch(
  safeChunkInsertValues(user, users).map((it) =>
    db.insert(user).values(it),
  ) as any,
)
Testing this approach with 5,000 records showed a performance improvement from 78ms to 14ms, making this optimization worthwhile.
Server-side issues differ significantly from client-side problems. While client-side errors only affect users, server-side errors can directly impact monthly bills and may take time to manifest. Therefore, caution and thorough unit testing are essential.
When addressing database query issues, I found it helpful to follow this process: discover, investigate, attempt to solve, monitor, try again if needed, continue monitoring, and then finalize. The first solution attempt may not succeed—it might even make things worse—but continuous monitoring is crucial for timely detection and resolution of issues.