Brian Hicks, June 16, 2025
I keep hearing claims like this:
- Not everyone in the US has access to stable, reliable internet, even in 2025.
- Web developers should stop assuming people have fast internet connections and slim their payloads accordingly.
This seems intuitively true to me—programmers are gonna have better connectivity because that takes money, and programmers are well-paid. But what's the actual scope of the problem?
I dug around, and here's some data. My goal here is not to beat anyone over the head with "THOU SHALT NOT ASSUME GOOD INTERNET" but to give an idea about the scope of broadband rollout in the US in a way that can help inform choices we make when designing software.
If you don't feel like reading this whole thing, here's the bottom line up front: you can probably assume internet access in somewhere around 97% of US households, but you should not assume that it's better than around 25Mbps down and 3Mbps up, and latency may be significantly worse than you previously assumed. This is likely worse for B2C software than B2B.
I'm going to pull from two US government agencies here: the Federal Communications Commission (FCC)and the National Center for Education Statistics (NCES) (part of the Department of Education.) All the data I'm referencing was published well before the current administration started gutting the bureaucracy, so I think it's fairly reliable.
Assumptions
Before we begin, there are a bunch of ways to define "stable" or "reliable" internet connections. For the purposes of this post, I'm defining that as a terrestrial link with at least 25Mbps down and 3Mbps up.
- Terrestrial because—well, have you ever tried to use a satellite connection for anything real? Latency is awful, and the systems tend to go down in bad weather. They also have had fairly low data caps historically so you had to use your connection judiciously, although this may be changing.
- 25/3Mpbs because that's a fairly common cable package speed, and also around the minimum I’ve been able to use modern SaaS apps on without it getting ridiculously frustrating. Zoom says you need 1–4 Mbps in both directions to do a video call.
The FCC's broadband map lets you set both these criteria. Let's have a look at it.
The FCC Broadband Map
The FCC tracks access to broadband internet in the US. As a result, they publish a map that's more accurate than the maps you see from ISPs. This isn't completely error-free, but individuals and companies can both submit data on coverage at a street address level and challenge inaccuracies in the existing data. For our purposes, I think it's good enough!
I'm going to grab some screenshots of the map to fix it at the current data for discussion. That way we can get an idea about regional coverage.
Strangely, they don't let you zoom out enough to grab a screenshot of the whole country so I'm going to look at the west. That'll get both urban and rural coverage, as well as several famously internet-y locations (San Francisco Bay Area, Seattle.)
If you want to follow along or compare how the data has changed since this post was published, you can get the map yourself at broadbandmap.fcc.gov.
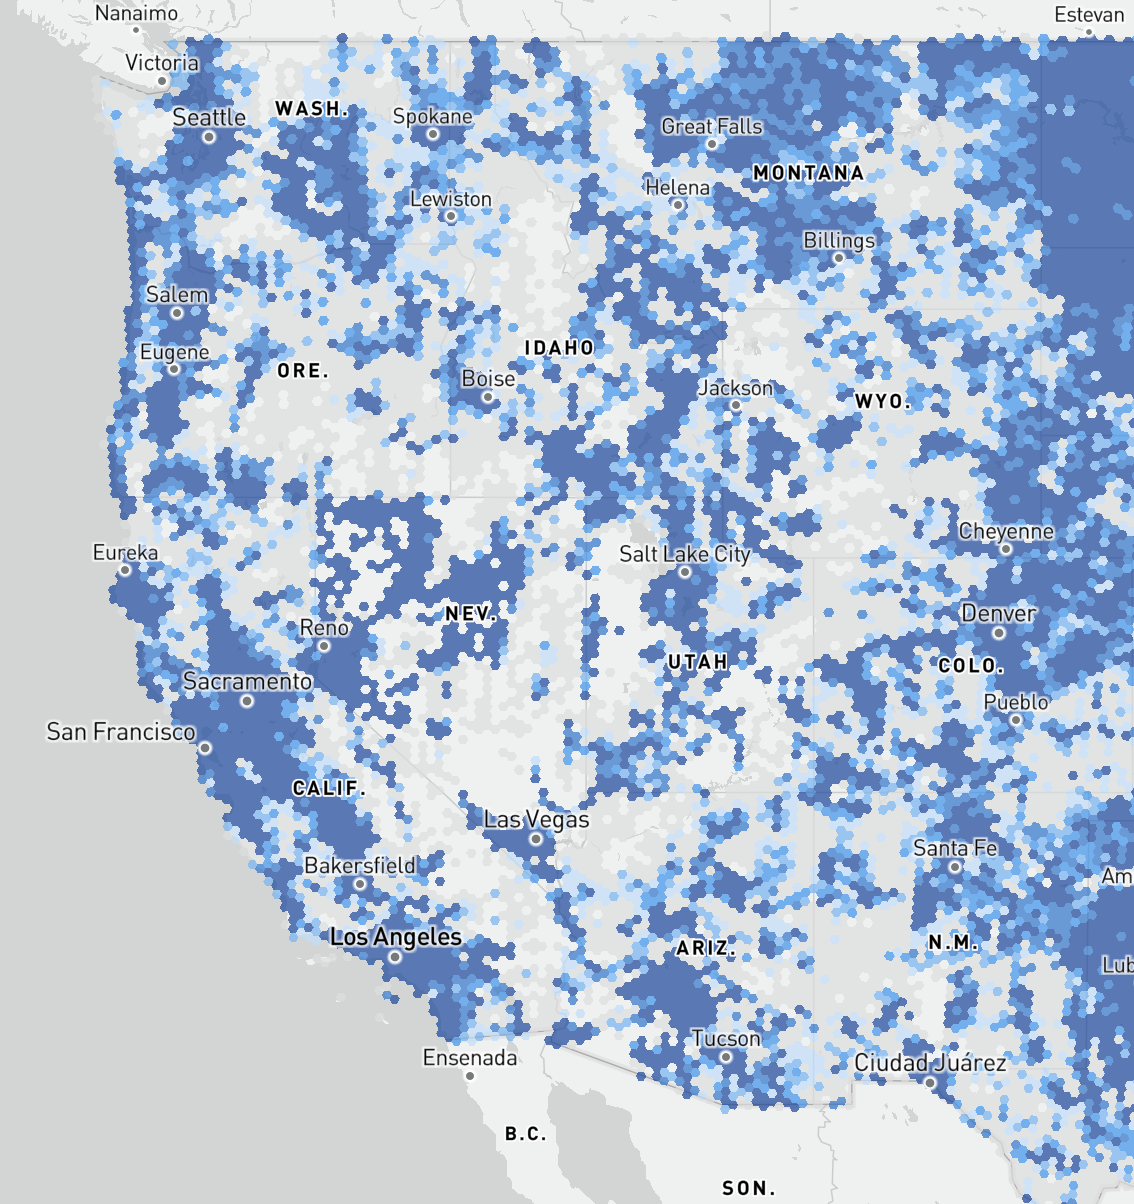
First, here's a hex map of coverage using the criteria we set above. The darker each hex is, the higher the percent coverage within it. Dark blue is 100%, white is 0%, grays or faded blues are in between.

This shows pretty much what I'd expect: coverage is fine in and around cities and less great in rural areas. (The Dakotas are an interesting exception; there's a co-op up there that connected a ton of folks with gigabit fiber. Pretty cool!)
Although, remember that these are minimum criteria. When I'm building software, I'm mostly doing it on my home internet. A test just now says I get 367/71Mpbs. What does the country look like if I were to expect all my users to have similar connections? The map lets us filter for 250/25; let's look:

Cities are pretty much unchanged, but rural coverage gets much worse. (Except again for North Dakota, the reigning champion of rural fiber.)
So what does this tell us about how we should design software? One big takeaway: if you design for the availability of fast internet connections, you'll exclude many people in rural areas.
This may or may not be OK for your market—"good internet" tends to be in population centers, and population centers tend to contain more businesses and consumers. You have to make that call!
However, it's also worth keeping in mind that this is a map of commercial availability, not market penetration. Hypothetically, you could get the average speed of a US residential internet connection, but the FCC doesn't make such a statistic available.
However, we have another source of data!
Student Internet Access
The US Department of Education occasionally tracks student internet access. Since classwork and homework have moved more online (especially during the early days of COVID) it's useful data for policy-making. The most recent data I could find is from 2021 but it gives us both a baseline for internet availability and some demographic data. Unfortunately, they don't track bandwidth, just raw availability. Still useful, though.
Here are the top-line statistics for all students in the US across several versions of the report:
| Category | % Available 2019 | % Available 2021 | Difference |
|---|---|---|---|
| Any internet access | 94.6% | 97.1% | +2.5 |
| Smartphone-only | 6.5% | 4.5% | -2.0 |
| No internet Access | 5.4% | 2.9% | -2.5 |
In 2021, they say that these statistics cover 66,108,000 students, which means 2.97 million students only had mobile access as of 2021.
Access gets worse, of course, with lower household income. Here's how those stats look for the lowest quartile:
| Category | % Available 2019 | % Available 2021 | Difference |
|---|---|---|---|
| Any internet access | 88.6% | 94.4% | +5.8 |
| Smartphone-only | 14.1% | 9.8% | -4.3 |
| No internet access | 11.4% | 5.6% | -5.8 |
Despite the fact that these numbers are going down, that's still a huge number of people in absolute terms (1.87 million students in this category with only mobile access.)
What Do We Do With This Information?
So that's a lot of words to say this: despite gains in the last couple of years, it's still not safe to assume that every user of your software either has access to stable internet, or is willing and able to pay to get high speeds.
That said, I'm deliberately not making any moral judgments here. If you think you're in a situation where you can ignore this data, I'm not going to come after you. But if you dismiss it out of hand, you're likely going to be putting your users (and business) in a tough spot.
I think it's worth considering a couple of scenarios in the parts of your software that someone interacts with regularly:
- What if that person is on a slow link? If you've never had bad internet access, maybe think of this as plane wifi. Rural satellite connections behave very similarly: high latency, speed and (sometimes) low data caps.
- What if that person is on a mobile/metered/capped network? Remember that 4G is like 5/1Mbps, and 3G is even worse. Big downloads are probably not a great idea.
This is also a very US-centric view, plus it doesn't consider latency from distance between your data center and your user's device. Still, though, I think this shows that this problem is real and we should take it into account when designing software.