
How reliant is your state on Uncle Sam’s wallet?
Every year, billions in federal tax dollars are redistributed to the 50 states and the District of Columbia through grants, contracts, and benefit programs.
Visual Capitalist's Pallavi Rao ranks the states to see who benefits the most from the flows so readers can see the fiscal winners and losers at a glance.
Data for this visualization comes from MoneyGeek, which uses Census Bureau and Bureau of Economic Analysis figures.
Their dependency score blends two metrics: the state’s return‐on‐taxes ratio and the share of state revenues coming from federal sources.
ℹ️ Return on taxes measures how much state residents—including businesses—receive in federal payments for every $1 paid in tax to the federal government.
Importantly, this data does not include Medicaid payments.
Finally, a state’s political affiliation is based on its voting history in the past five presidential elections.
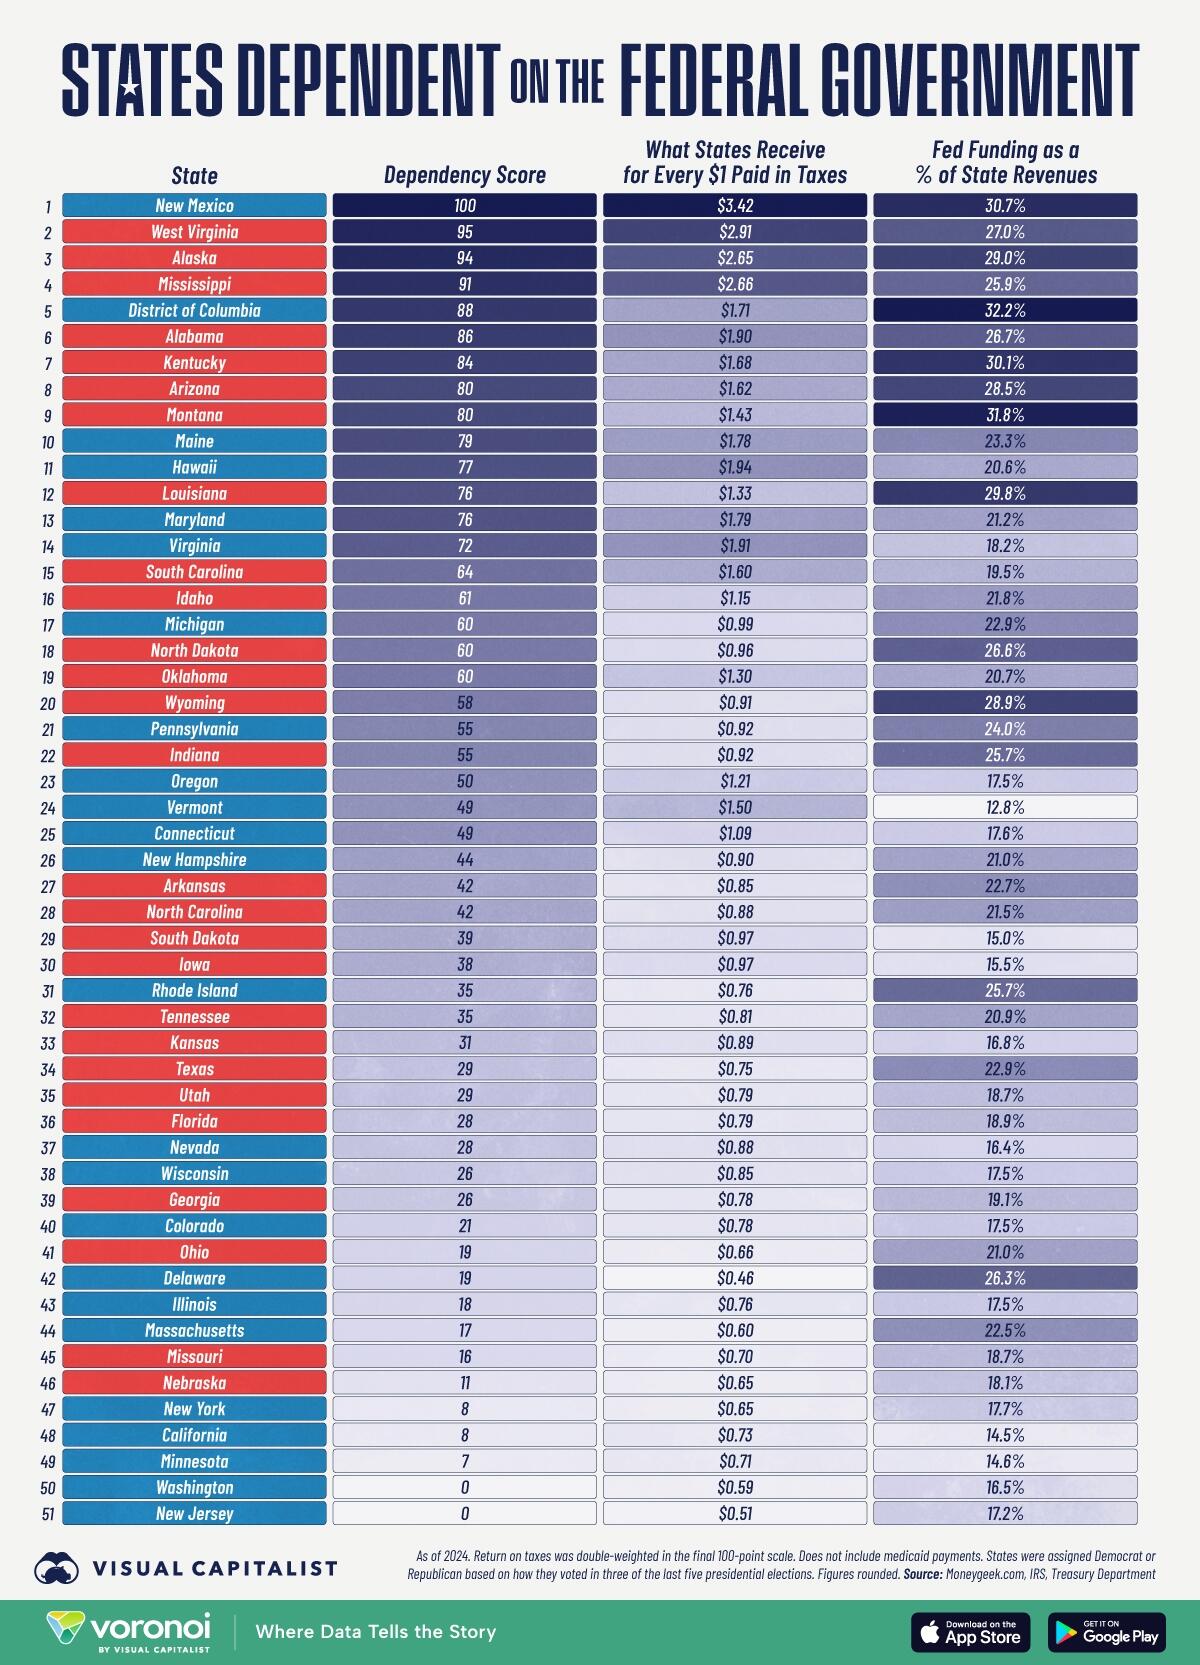
Ranked: States That Need the Federal Government the Most
New Mexico tops the 2024 list for states most dependent on the federal government, with a perfect score of 100.
Its residents receive $3.42 for every tax dollar they send to Washington, while the state covers nearly a third of its budget with federal funds.
| Rank | State | Political Affiliation | Dependency Score | Return on Taxes | % of State Revenues From Federal Funding |
|---|---|---|---|---|---|
| 1 | New Mexico | Blue | 100 | $3.42 | 30.7% |
| 2 | West Virginia | Red | 95 | $2.91 | 27.0% |
| 3 | Alaska | Red | 94 | $2.65 | 29.0% |
| 4 | Mississippi | Red | 91 | $2.66 | 25.9% |
| 5 | District of Columbia | Blue | 88 | $1.71 | 32.2% |
| 6 | Alabama | Red | 86 | $1.90 | 26.7% |
| 7 | Kentucky | Red | 84 | $1.68 | 30.1% |
| 8 | Arizona | Red | 80 | $1.62 | 28.5% |
| 9 | Montana | Red | 80 | $1.43 | 31.8% |
| 10 | Maine | Blue | 79 | $1.78 | 23.3% |
| 11 | Hawaii | Blue | 77 | $1.94 | 20.6% |
| 12 | Louisiana | Red | 76 | $1.33 | 29.8% |
| 13 | Maryland | Blue | 76 | $1.79 | 21.2% |
| 14 | Virginia | Blue | 72 | $1.91 | 18.2% |
| 15 | South Carolina | Red | 64 | $1.60 | 19.5% |
| 16 | Idaho | Red | 61 | $1.15 | 21.8% |
| 17 | Michigan | Blue | 60 | $0.99 | 22.9% |
| 18 | North Dakota | Red | 60 | $0.96 | 26.6% |
| 19 | Oklahoma | Red | 60 | $1.30 | 20.7% |
| 20 | Wyoming | Red | 58 | $0.91 | 28.9% |
| 21 | Pennsylvania | Blue | 55 | $0.92 | 24.0% |
| 22 | Indiana | Red | 55 | $0.92 | 25.7% |
| 23 | Oregon | Blue | 50 | $1.21 | 17.5% |
| 24 | Vermont | Blue | 49 | $1.50 | 12.8% |
| 25 | Connecticut | Blue | 49 | $1.09 | 17.6% |
| 26 | New Hampshire | Blue | 44 | $0.90 | 21.0% |
| 27 | Arkansas | Red | 42 | $0.85 | 22.7% |
| 28 | North Carolina | Red | 42 | $0.88 | 21.5% |
| 29 | South Dakota | Red | 39 | $0.97 | 15.0% |
| 30 | Iowa | Red | 38 | $0.97 | 15.5% |
| 31 | Rhode Island | Blue | 35 | $0.76 | 25.7% |
| 32 | Tennessee | Red | 35 | $0.81 | 20.9% |
| 33 | Kansas | Red | 31 | $0.89 | 16.8% |
| 34 | Texas | Red | 29 | $0.75 | 22.9% |
| 35 | Utah | Red | 29 | $0.79 | 18.7% |
| 36 | Florida | Red | 28 | $0.79 | 18.9% |
| 37 | Nevada | Blue | 28 | $0.88 | 16.4% |
| 38 | Wisconsin | Blue | 26 | $0.85 | 17.5% |
| 39 | Georgia | Red | 26 | $0.78 | 19.1% |
| 40 | Colorado | Blue | 21 | $0.78 | 17.5% |
| 41 | Ohio | Red | 19 | $0.66 | 21.0% |
| 42 | Delaware | Blue | 19 | $0.46 | 26.3% |
| 43 | Illinois | Blue | 18 | $0.76 | 17.5% |
| 44 | Massachusetts | Blue | 17 | $0.60 | 22.5% |
| 45 | Missouri | Red | 16 | $0.70 | 18.7% |
| 46 | Nebraska | Red | 11 | $0.65 | 18.1% |
| 47 | New York | Blue | 8 | $0.65 | 17.7% |
| 48 | California | Blue | 8 | $0.73 | 14.5% |
| 49 | Minnesota | Blue | 7 | $0.71 | 14.6% |
| 50 | Washington | Blue | 0 | $0.59 | 16.5% |
| 51 | New Jersey | Blue | 0 | $0.51 | 17.2% |
Note: The tax return ratio was given double-weight in the final score.
West Virginia, Alaska, and Mississippi follow closely, each exceeding $2.60 in returns and relying on federal transfers for more than a quarter of state revenues.
The outlier is the District of Columbia: despite a lower tax return multiple ($1.71), 32% of its revenue comes from the federal government. This is unsurprising given its role as the nation’s administrative hub.
Federal Dependency: Red vs. Blue States
MoneyGeek’s ranking reveals a partisan tilt: seven of the states with the top 10 dependency scores are red, including conservative strongholds such as Alabama, Kentucky, and Montana.
Meanwhile, 11 of the 20 net tax recipient states have voted Republican in at least three of the past five presidential elections.
Yet political color is not destiny. Deep-blue New Mexico and D.C. also sit near the top.
MoneyGeek’s analysis points to economic structure rather than ideology: energy extraction, military installations, and a high share of retirees often correlate with greater federal inflows.
The Big List of Donor States
At the opposite end, New Jersey and Washington score zero, receiving roughly half a dollar back for every dollar paid their residents pay in taxes.
California, New York, and Minnesota also run sizable “deficits,” each collecting less than 75 cents on the dollar.
These donor states tend to have large, diversified economies and higher-than-average household incomes, boosting tax receipts while limiting eligibility for certain federal aid programs.
Their contributions effectively subsidize public services elsewhere—fueling perennial debates over tax fairness and redistribution.
For more insights, cross-reference this post with Visualizing $29 Trillion Economy by State on Voronoi, the new app from Visual Capitalist.