
I’ve been obsessing over color quantization algorithms lately, and when I learned that an image conversion app called Composite did its so-called pixel mapping step in CIELAB space, I instantly thought of the “HyAB” color distance formula I’d seen in the FLIP error metric paper from 2020.
By “pixel mapping” I mean choosing for each pixel the closest color in a fixed palette. This results in a compressed version of the original image. The closest color is the one with the shortest Euclidean distance, computed in 3D for the RGB coordinates. Unfortunately it’s not perceptually uniform, so two colors with a small computed color difference might actually look very different to the human eye.
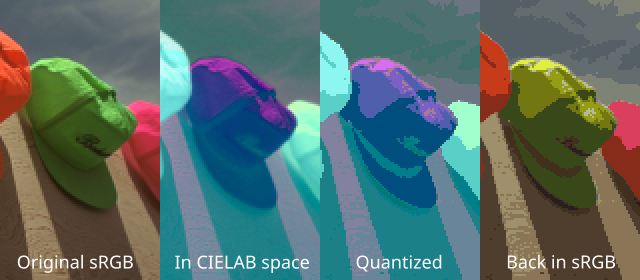
Computing color differences in sRGB space is surprisingly decent but there are better options. The CIELAB aka L*a*b* space represents colors as their perceived brightness component L, the “luminance”, and two components a and b that encode a “chrominance” coordinate in a 2D (red-green, blue-yellow) plane. Notably the L component is still gamma corrected here but with gamma=3 instead of 2.2 like in sRGB.
Given two colors (L^*_1, a^*_1, b^*_1) and (L^*_2, a^*_2, b^*_2) in the CIELAB color space, it’s simple to compute their difference, again, by their Euclidean distance:
\text{Euclidean} = \sqrt{(L^*_1 - L^*_2)^2 + (a^*_1 - a^*_2)^2 + (b^*_1 - b^*_2)^2}
This is also known as the “CIE 1976” formula and apparently the reason CIELAB’s existence. Unfortunately it breaks down in large differences and also fails in some shades of blue. Wikipedia lists three later, increasingly complex, supposedly better-behaved formulas from years 1984, 1994, and 2001. But what if there’s a simpler fix?
Now we get to the point. In a 2019 paper Distance metrics for very large color differences, Saeedeh Abasi and colleagues suggest the following “CD1” formula large color distances:
\text{CD1} = |L^*_1 - L^*_2| + \sqrt{(a^*_1 - a^*_2)^2 + (b^*_1 - b^*_2)^2}
So now we take an absolute difference in lightness and an Euclidean distance in chromaticities. It’s a hybrid of a “city block” and Euclidean distance of (a,b), so they called this space “HyAB”. I’ll just call the CD1 formula above with that name for simplicity.
In the paper, they justify this choice with “psychological separability” between lightness and the two other color dimensions, hue and chroma. They ran an experiment with 17 participants and its results suggest HyAB is more faithful to large observed color differences than an Euclidean distance or the CIEDE2000 formula from 2001. I’m convinced! Time to try it in practice.
k-means in CIELAB space
I’ll apply the new distance formula to a color quantization problem. Given an 24-bit image, find a palette of K colors the represent the image well, and then reconstruct the image using only the palette colors alone. This can be considered a clustering problem with a known number of centers, so we can directly apply k-means to it.
Recall the two alternating steps of k-means: assigning each point to the closest cluster, and computing new cluster centers as averages of their assigned points. The first step is usually the Euclidean distance but let’s change that to HyAB instead and see what happens.
To be clear, running k-means in CIELAB is nothing new. For example Google’s material-color-utilities project does it. The HyAB distance formula in it is the novelty here.
Below a quick comparison of 16-color paletted versions between an input image, Pillow’s quantize(), libimagequant, and my implementation (GitHub, local copy) of modified k-means in CIELAB space with the HyAB formula plugged in.
It really seems to work! But is this better than doing k-means directly in sRGB or CIELAB space with the Euclidean distance?
Comparison to sRGB and pure CIELAB
Perhaps the most useful thing about the HyAB formulation is how it affords a clear way to control luminance-vs-color error. In the distance function we can multiply |L^*_1 - L^*_2| by say, two, without introducing wrong hues.
Consider the examples below. The non-weighted version is on the left, exaggarated luminance distance on the right.
Slightly more definition in the green hat, the magenta hat kept its color. Works fine.
The result without any weighting is quite poor. Here I tried to use the same per-channel weights and internal gamma as libimagequant. On the right, the green hat gets an uncanny level of detail but is a bit dim and the magenta hat becomes red and grey. Clouds get more definition.
Boosting the L-channel in the usual CIELAB space does give more definition to the red and green hat but magenta has the wrong hue again. Clouds get more definition. Perhaps a smaller than a 2x L-channel boost would’ve been fairer here because of the Euclidean norm.
Anyway, these examples suggest HyAB is at least easier to control.
The second step in k-means computes new cluster centroids (palette colors) as averages of their assigned points (input pixels). This is perfect when trying to minimize the Euclidean distances between points and their cluster centers but that’s not the case anymore with HyAB.
As you might know, the sum of absolute differences is minimized by the median, not the mean of a dataset.
So now the two steps of k-means optimize for slightly different objectives in the L component.
Fortunately it’s easy to change: In my modified k-means code I literally call np.median instead of np.mean for the first column of the data matrix:
centers[k, 0:1] = np.median(X[k_inds, 0:1], axis=0)
centers[k, 1:3] = np.mean(X[k_inds, 1:3], axis=0)
The algorithm is now halfway between k-medians and k-means :) This change does add a small visible difference. Can you spot it below?
The red hat has now a small halo (bad) but the cap of the magenta hat is not grey anymore (good). In this example the median version is not obviously better but I still decided to use it because it’s theoretically nicer™.
Real-world use
In the end, the implementation of an image compression system determines how good the results get, not the final 1% of quality in its algorithms. I’m talking about practical matters such as choosing the number of colors automatically, hiding banding, adding a small contrast boost, or doing correct linear-space downscaling. And of course dithering can spread errors more evenly.
Consider the “max coverage” algorithm from Pillow. On its own the results are horrendous but when you add dithering, it’s suddenly better than anything else above!
Perhaps k-means plus dithering would look even better but the point is that a poor quantizer that fits the rest of the system can be good enough.
Also, CIELAB doesn’t mean automatically better results. For example in this 256-color test done on the “two macaws” photo, a regular sRGB k-means produces smoother gradients. I suppose it’s because CIELAB’s gamma gives more weight to darker shades.
See for example a bokeh blob in the upper right corner:

For reference, here are the 256-color k-means results for the original 768x512 image: sRGB, CIELAB, CIELAB with HyAB.
When to use it
HyAB could be a small improvement when computing large color differences, for example when mapping colors to fixed palettes of retro computers, mainly due to its controllability. I can’t recommend it as a drop-in replacement for CIELAB or carefully weighted sRGB before other aspects of a system have already been tuned to the max.
I’m writing a book on computer graphics. Sign up here if you’re interested.