Video killed the radio star.
And the video game industry’s explosive growth over the last five decades has killed any skepticism of its strength and staying power in the larger media and entertainment space.
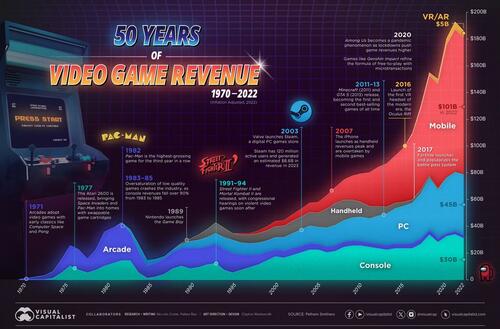
Visual Capitalist's Pallavi Rao and Niccolo Conte visualize the video game industry’s inflation-adjusted revenues every year, from its humble beginnings in 1970 to the media juggernaut it is now, worth more than $180 billion of revenue in 2022.

All data presented in the chart and in this article was provided by UK-based market intelligence firm Pelham Smithers.
| Year | Total Game Industry Revenue (USD, Billions) | % Increase (YoY) |
|---|---|---|
| 1970 | $0 | N/A |
| 1971 | $1 | N/A |
| 1972 | $2 | 100% |
| 1973 | $3 | 50% |
| 1974 | $6 | 100% |
| 1975 | $15 | 150% |
| 1976 | $25 | 67% |
| 1977 | $22 | -12% |
| 1978 | $15 | -32% |
| 1979 | $22 | 47% |
| 1980 | $35 | 59% |
| 1981 | $38 | 9% |
| 1982 | $42 | 11% |
| 1983 | $37 | -12% |
| 1984 | $26 | -30% |
| 1985 | $14 | -46% |
| 1986 | $15 | 7% |
| 1987 | $17 | 13% |
| 1988 | $22 | 29% |
| 1989 | $27 | 23% |
| 1990 | $30 | 11% |
| 1991 | $33 | 10% |
| 1992 | $37 | 12% |
| 1993 | $42 | 14% |
| 1994 | $38 | -10% |
| 1995 | $34 | -11% |
| 1996 | $34 | 0% |
| 1997 | $34 | 0% |
| 1998 | $36 | 6% |
| 1999 | $39 | 8% |
| 2000 | $43 | 10% |
| 2001 | $44 | 1% |
| 2002 | $48 | 10% |
| 2003 | $52 | 8% |
| 2004 | $57 | 9% |
| 2005 | $57 | 1% |
| 2006 | $62 | 9% |
| 2007 | $68 | 10% |
| 2008 | $74 | 8% |
| 2009 | $77 | 4% |
| 2010 | $78 | 2% |
| 2011 | $79 | 1% |
| 2012 | $83 | 5% |
| 2013 | $85 | 3% |
| 2014 | $91 | 7% |
| 2015 | $97 | 6% |
| 2016 | $108 | 11% |
| 2017 | $128 | 19% |
| 2018 | $152 | 19% |
| 2019 | $147 | -3% |
| 2020 | $177 | 20% |
| 2021 | $190 | 7% |
| 2022 | $183 | -4% |
Note: Numbers are rounded to the nearest billion.
From an industry that was nearly wiped out by a market crash, to the highest-earning media sector today, video games have had a tumultuous journey.
As medium has evolved, so too have the consumer preferences for different gaming platforms. Which formats led the overall industry’s revenue growth through the years?
Arcades, Home Consoles, Handheld Gaming
The history of mass-market consumer-oriented video games starts with Atari.
The company that released Computer Space (1971) and Pong (1972) on coin-operated arcade machines took the market by storm, spawning a series of competitors, earning an estimated $35-40 per day, and selling nearly 8,000 units in two years.
For an industry that barely existed until a couple years prior, those numbers spurred the inception of video games as a legitimate (and profitable) form of entertainment.
| Year | Arcade Revenues (USD, Billions) |
Console Revenues (USD, Billions) |
Handheld Revenues (USD, Billions) |
|---|---|---|---|
| 1970 | $0 | N/A | N/A |
| 1971 | $1 | N/A | N/A |
| 1972 | $2 | N/A | N/A |
| 1973 | $3 | N/A | N/A |
| 1974 | $5 | $1 | N/A |
| 1975 | $10 | $5 | N/A |
| 1976 | $15 | $10 | N/A |
| 1977 | $15 | $7 | N/A |
| 1978 | $10 | $5 | N/A |
| 1979 | $15 | $7 | N/A |
| 1980 | $25 | $10 | N/A |
| 1981 | $26 | $12 | N/A |
| 1982 | $27 | $14 | N/A |
| 1983 | $20 | $14 | N/A |
| 1984 | $15 | $5 | N/A |
| 1985 | $9 | $1 | N/A |
| 1986 | $10 | $2 | N/A |
| 1987 | $11 | $4 | N/A |
| 1988 | $12 | $8 | N/A |
| 1989 | $13 | $10 | $1 |
| 1990 | $15 | $8 | $2 |
| 1991 | $14 | $9 | $4 |
| 1992 | $13 | $11 | $6 |
| 1993 | $14 | $12 | $8 |
| 1994 | $15 | $7 | $7 |
| 1995 | $14 | $5 | $5 |
| 1996 | $11 | $7 | $6 |
| 1997 | $9 | $9 | $7 |
| 1998 | $7 | $11 | $7 |
| 1999 | $6 | $14 | $8 |
| 2000 | $5 | $17 | $8 |
| 2001 | $5 | $16 | $9 |
| 2002 | $5 | $18 | $9 |
| 2003 | $5 | $20 | $10 |
| 2004 | $5 | $22 | $10 |
| 2005 | $4 | $22 | $11 |
| 2006 | $4 | $20 | $14 |
| 2007 | $4 | $21 | $16 |
| 2008 | $4 | $24 | $15 |
| 2009 | $4 | $25 | $13 |
| 2010 | $3 | $25 | $11 |
| 2011 | $3 | $24 | $9 |
| 2012 | $3 | $23 | $7 |
| 2013 | $3 | $22 | $5 |
| 2014 | $3 | $23 | $4 |
| 2015 | $3 | $23 | $3 |
| 2016 | $4 | $23 | $3 |
| 2017 | $4 | $26 | $3 |
| 2018 | $3 | $33 | $2 |
| 2019 | $3 | $28 | $1 |
| 2020 | $2 | $32 | $0 |
| 2021 | $2 | $33 | $0 |
| 2022 | $2 | $30 | $0 |
| Share of Total Industry Revenue in 2022 |
1.1% | 16.6% | 0.0% |
Note: Numbers are rounded to the nearest billion.
Within just seven years, thanks to the proliferation of arcade games, the video game industry generated more revenue than the American box office and music industry put together.
Then, in the 1980s, a once little-known playing card company in Japan released one of the best-selling video game franchises ever, Super Mario Bros on their home console the Nintendo Entertainment System (NES).
A few years later, at the cusp of the ’90s, Nintendo released the iconic Game Boy on which enthusiasts could play Tetris—a popular arcade game—from the comfort of their bed, cementing video games’ place in consumers’ homes.
PC Gaming, Mobile Gaming, and Virtual Reality
By the ’90s, another technological boom was taking place: the rise of personal computing.
Naturally, companies developed video games (like Doom, Prince of Persia, Dangerous Dave) for this new platform, taking advantage of increased computing power, bigger screens, and more flexibility in programming.
While home consoles still accounted for the majority share of the industry’s revenues, handheld devices and PC gaming split the difference as arcade revenues began to drop rapidly.
| Year | PC Revenues (USD, Billions) |
Mobile Revenues (USD, Billions) |
VR/AR Revenues (USD, Billions) |
|---|---|---|---|
| 1982 | $1 | N/A | N/A |
| 1983 | $3 | N/A | N/A |
| 1984 | $6 | N/A | N/A |
| 1985 | $4 | N/A | N/A |
| 1986 | $3 | N/A | N/A |
| 1987 | $2 | N/A | N/A |
| 1988 | $2 | N/A | N/A |
| 1989 | $3 | N/A | N/A |
| 1990 | $5 | N/A | N/A |
| 1991 | $6 | N/A | N/A |
| 1992 | $7 | N/A | N/A |
| 1993 | $8 | N/A | N/A |
| 1994 | $9 | N/A | N/A |
| 1995 | $10 | N/A | N/A |
| 1996 | $9 | $1 | N/A |
| 1997 | $9 | $1 | N/A |
| 1998 | $9 | $2 | N/A |
| 1999 | $9 | $3 | N/A |
| 2000 | $9 | $4 | N/A |
| 2001 | $10 | $4 | N/A |
| 2002 | $11 | $5 | N/A |
| 2003 | $12 | $6 | N/A |
| 2004 | $13 | $7 | N/A |
| 2005 | $13 | $8 | N/A |
| 2006 | $14 | $10 | N/A |
| 2007 | $15 | $12 | N/A |
| 2008 | $16 | $15 | N/A |
| 2009 | $17 | $18 | N/A |
| 2010 | $18 | $21 | N/A |
| 2011 | $18 | $25 | N/A |
| 2012 | $21 | $29 | N/A |
| 2013 | $23 | $32 | N/A |
| 2014 | $26 | $35 | N/A |
| 2015 | $28 | $40 | N/A |
| 2016 | $30 | $48 | $1 |
| 2017 | $34 | $60 | $2 |
| 2018 | $39 | $74 | $2 |
| 2019 | $35 | $77 | $3 |
| 2020 | $41 | $98 | $5 |
| 2021 | $44 | $105 | $6 |
| 2022 | $45 | $101 | $5 |
| Share of Total Industry Revenue in 2022 |
24.5% | 55.3% | 2.5% |
Note: Numbers are rounded to the nearest billion.
However, handheld gaming revenues peaked in 2007, the year the iPhone launched, and have steadily declined since then as smartphone adoption has grown.
With smartphones came the mobile gaming juggernaut, which has made up more than half of the gaming industry’s revenues since 2019.
In the last few years however, the development of augmented and virtual reality’s more immersive, and sensory-heavy experiences have created yet another platform for video games, and yet another avenue for growth.