原文
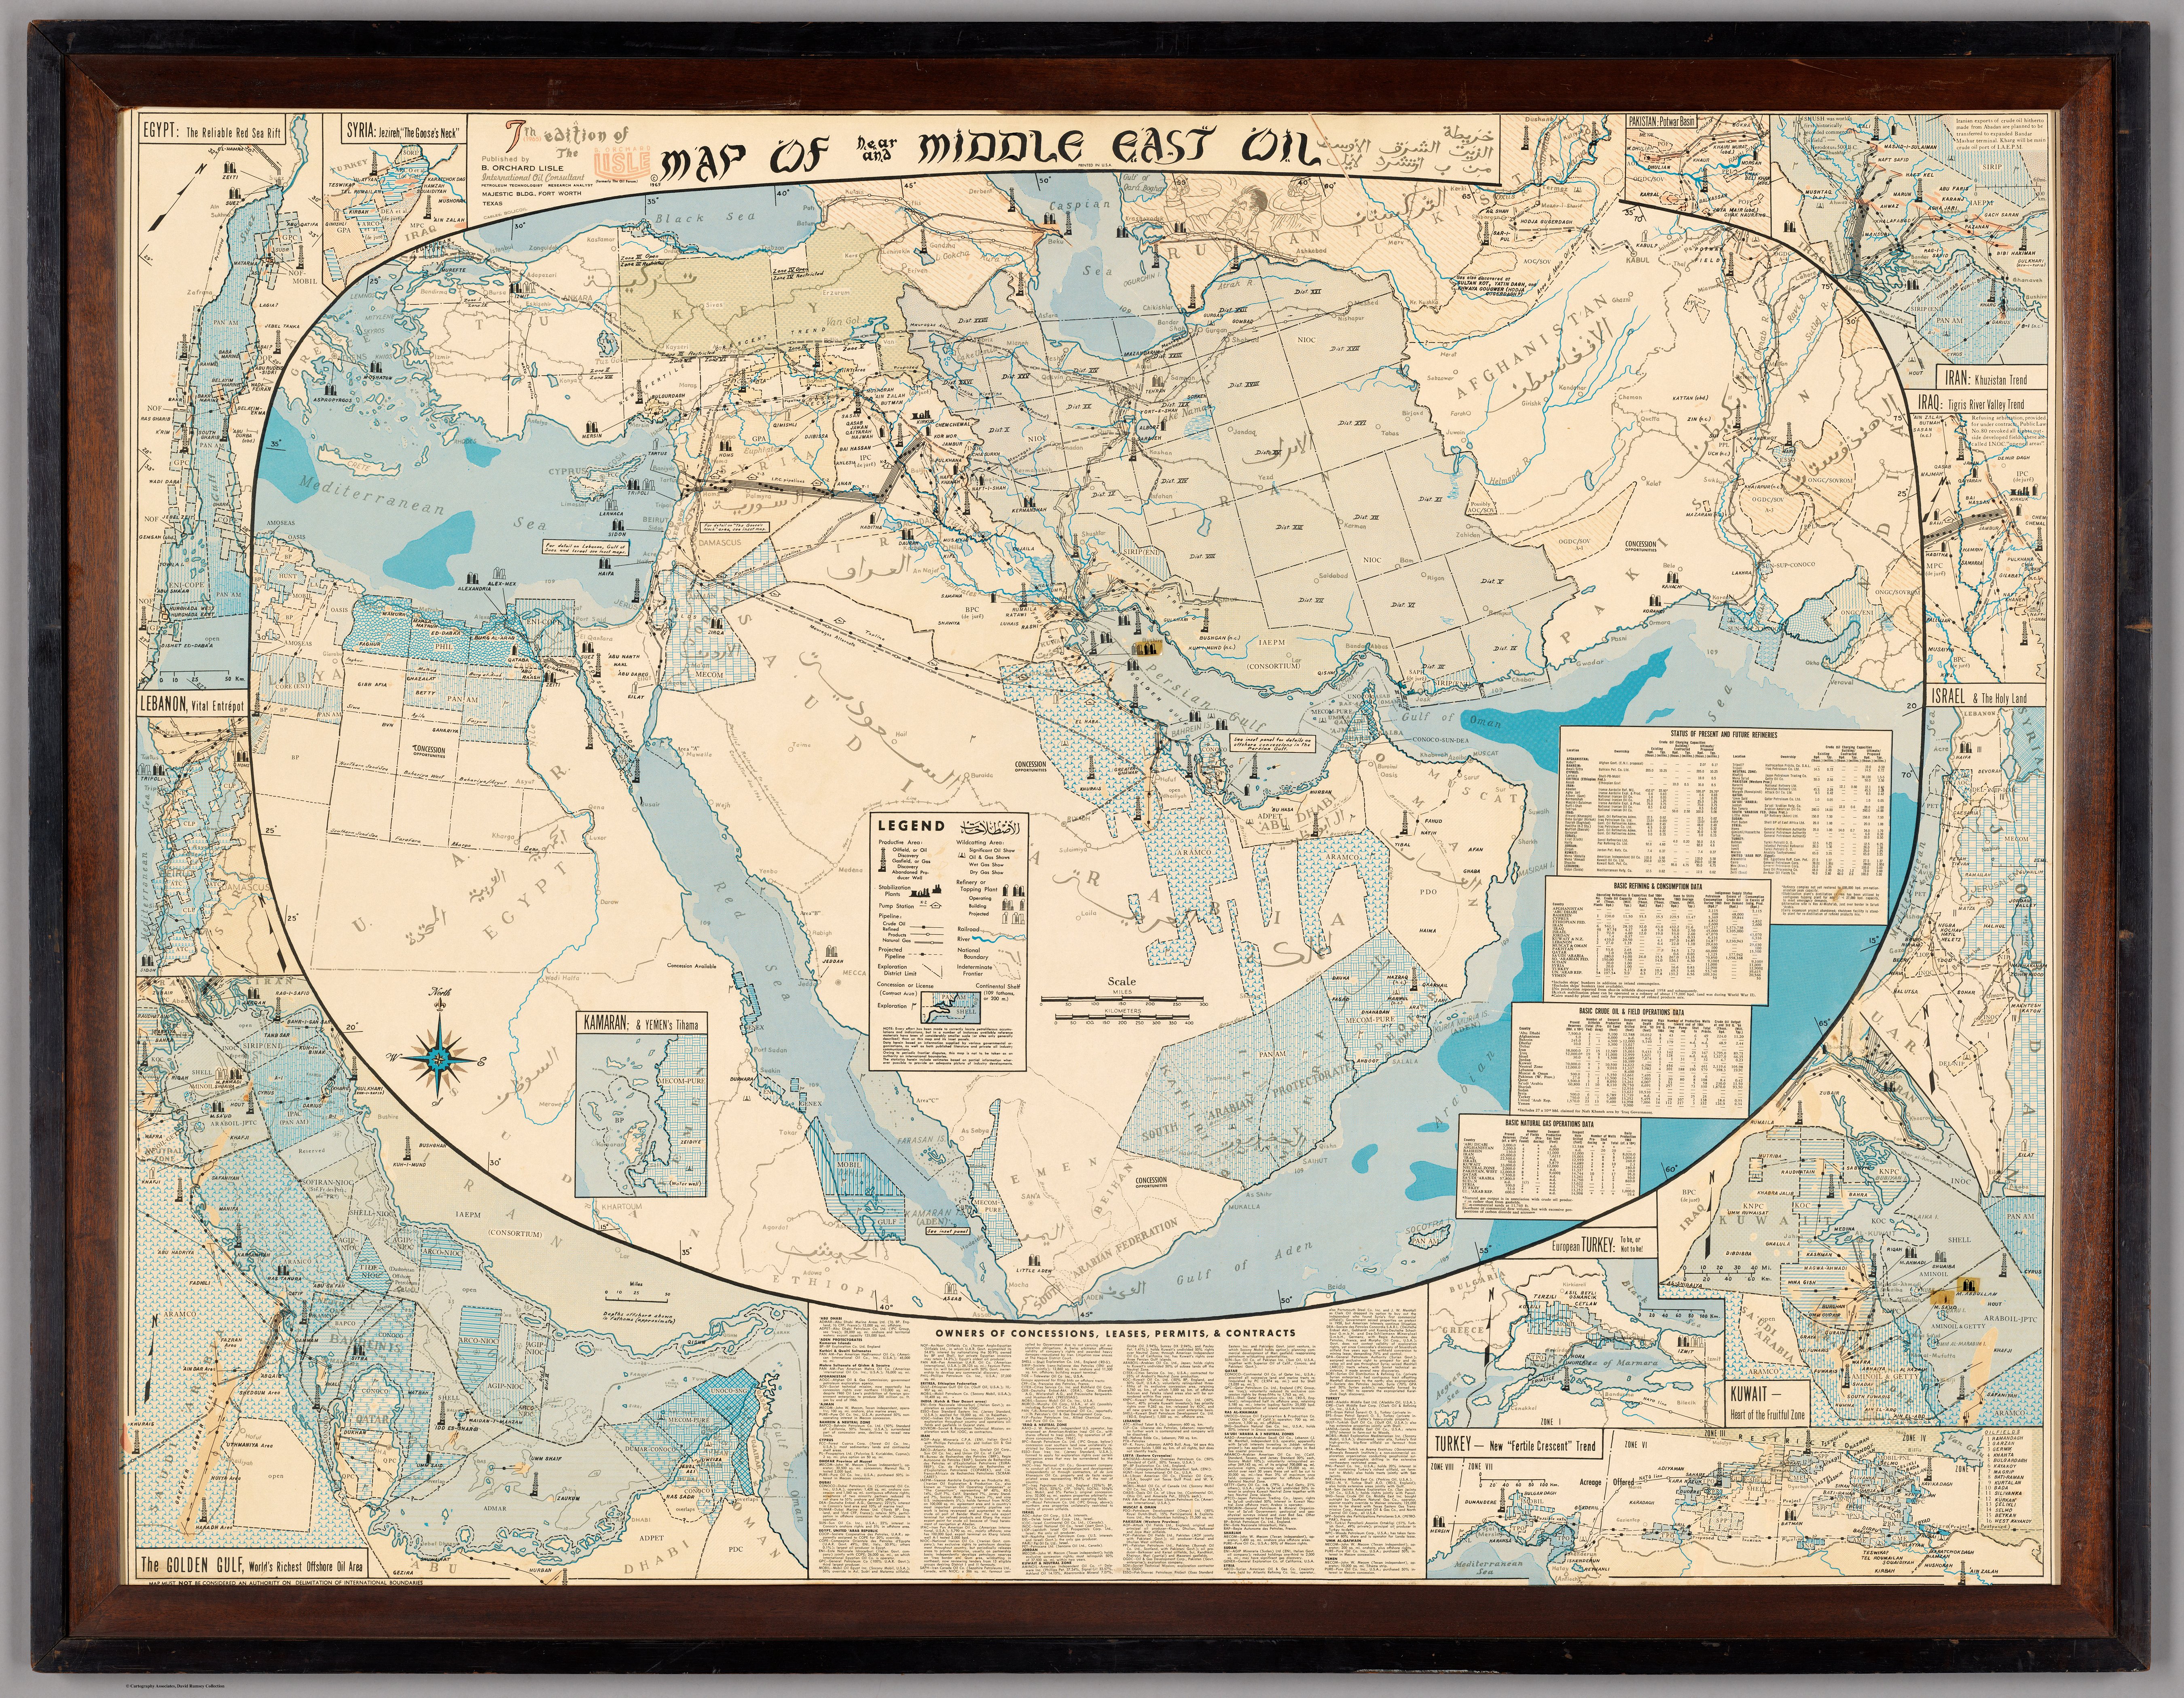
Networks are a central visual and analytical feature of this map. Here’s a breakdown of the networks present, what they mean, and how they relate to the map’s context:
1. Oil and Gas Pipeline Networks
- Major Pipelines: Heavy lines traverse the map, notably from Iraq (Kirkuk) to the Mediterranean (Tripoli, Haifa), from the Persian Gulf inland, and across the Arabian Peninsula. These pipelines connect oilfields to export terminals and refineries, forming the literal backbone of the Middle Eastern oil economy.
- Example: The Iraq Petroleum Company pipeline runs from northern Iraq westward to the Mediterranean.
- Additional Examples: Pipelines from Abadan (Iran), Dhahran-Dammam (Saudi Arabia), and Kuwait to coastlines and terminals.
- Legend: The legend at lower center distinguishes between types of pipelines (existing, under construction, projected).
2. Oilfield and Refinery Networks
- Fields and Refineries: Networks of oilfields (clusters of wells, symbolized by icons) are shown in:
- Southeastern Iran
- Kuwait
- Eastern Saudi Arabia (Ghawar, Dhahran)
- Northern Iraq
- Bahrain
- Qatar
- Baku (Azerbaijan)
- Refineries and Terminals: These are networked nodes, connected by pipelines and shipping routes.
3. Concession and Ownership Networks
- Company Areas: Shaded patterns and color blocks delineate which multinational or national company controls which areas.
- Inset tables and lower text blocks list the principal owners, revealing a web of corporate and political control stretching across national borders.
- Contracts and Permits: These are mapped as overlapping zones, emphasizing the legal and economic network underlying physical infrastructure.
4. Maritime and Shipping Networks
- Tanker Terminals: Coastal nodes show where oil is loaded for maritime transport, connecting Middle Eastern production to global consumption.
- Shipping Routes: While not always explicitly drawn, the proximity of terminals to major sea lanes (Persian Gulf, Red Sea, Mediterranean) suggests the networked nature of oil export.
5. Regional and International Networks
- Inset Maps: Marginal insets provide high-density detail for network nodes (e.g., Kuwait, Dhahran, Baku), showing how networks become denser at critical points.
- Transnational Connections: Pipelines and concession boundaries frequently cross modern political borders, underlining the supra-national character of the oil network.
Interpretive Significance
- Technical and Political Network: The map reveals not just the physical infrastructure but the political-economic web of relationships—companies, concession boundaries, and intergovernmental arrangements.
- Historical Context: In 1965, these networks were dominated by Western companies, but the complexity also hints at coming shifts (nationalization, OPEC).
- Integrated System: The map visually asserts that the Middle East’s oil is not a collection of isolated sites, but a tightly interwoven system shaping global politics and economics.
Conclusion
The map is a diagram of networks—pipelines, oilfields, terminals, company concessions, and shipping routes—depicting the Middle East’s oil as a vast, interdependent system. These networks are both physical (infrastructure) and abstract (ownership, contracts), making the map a powerful tool for understanding the strategic importance and international entanglement of oil in the mid-20th century. AI analysis.