Authored by Simon White, Bloomberg macro strategist,
The rising wall of corporate loans and debt to be refinanced will increasingly stress company balance sheets, leading to a secular rise in equity volatility.
Tensions in the Middle East are adding uncertainty to the outlook. What does that mean for volatility? So far it has led to at least a temporary rise in equity-market volatility, but in recent years any increase has been fairly short lived, despite the sort of catalysts that would be expected to keep it persistently elevated.
Greater uncertainty, therefore, does not necessarily lead to greater volatility. However, a much surer reason why it is destined to see a structural rise in the coming quarters is mounting evidence that the credit cycle is nearing its late stages.
Finance is about cycles. There are business cycles, inventory cycles, housing cycles and liquidity cycles. They all typically dance to their own beat, but they often lead and follow each other in fairly regular ways.
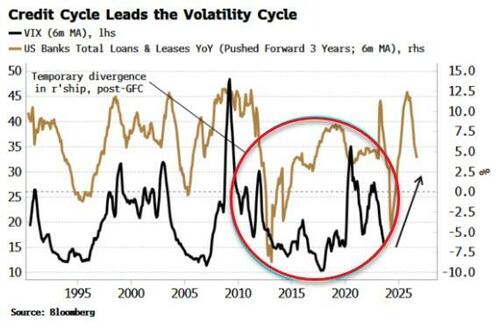
One of the most important of these relationships is between the credit cycle and the volatility cycle. Simply put, the credit cycle leads the volatility cycle, and the cracks in credit we are now seeing, along with the wave of upcoming bond and loan refinancings, mean that equity volatility will see a secular move higher.
As the chart below shows, rises in bank-loan growth have typically led rises in the VIX by an average of three years.
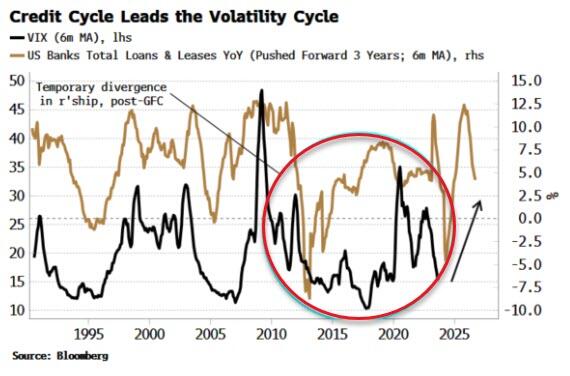
Corporate balance sheets explain the link between credit and volatility. As credit expands, loan growth rises, funding business investment and consumer spending. But when the loans come due, they often need to be refinanced. This stresses both sides of corporate balance sheets. As equity is just a thin wafer of capital on the balance sheet, it must bear the adjustment, meaning that equity volatility rises.
The lead time in the relationship is explained by the average maturity of loans. In the aftermath of the GFC, ultra-low rates meant rising loan maturities and less difficulty in re-financing debt, explaining the disconnect in the relationship from 2010 to 2020.
But as everyone now knows, that was an anomalous period, and the relationship is beginning to re-assert itself as rates rise, loan periods contract, and bankruptcies increase. The die is cast for increasing stress on firms’ equity.
We’ve only looked at bank loans so far, but we can get greater visibility on the credit cycle’s outlook by looking at corporate debt. Corporate debt outstanding accounts for ~80% of total corporate credit (debt + C&I loans), excluding private credit.
Average debt maturity for both investment-grade (IG) and high-yield (HY) corporate debt is falling, ultimately compressing the lead time between the expansion of credit and the rise in equity volatility.
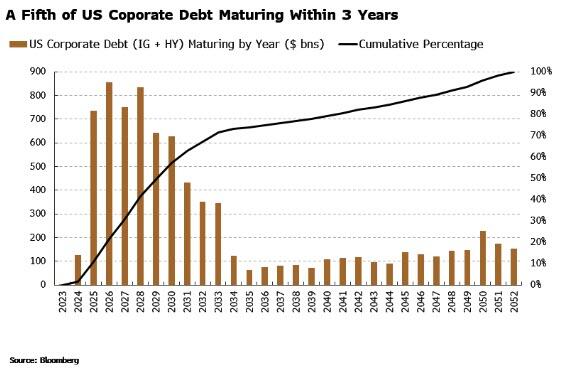
Further, the size of refinancings will accelerate in the coming years.
Using the bonds in the Bloomberg IG and HY bond indices as a proxy, which account for 70% of the US market (excluding debt of maturity under one year), we can expect around a fifth of US corporate debt to mature within three years, and half by 2030.
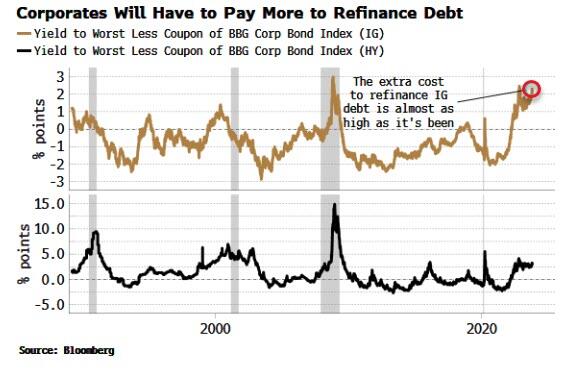
To add fuel to the fire, most of this debt that needs to be refinanced will have to be done so at a considerably higher rate. The differential between the weighted-average yield and coupon on both the Bloomberg HY and IG bond indices has widened sharply over the last few years, to approximately three and two percentage points respectively, with the yield on IG debt about as high as it has ever been above the coupon of the index.
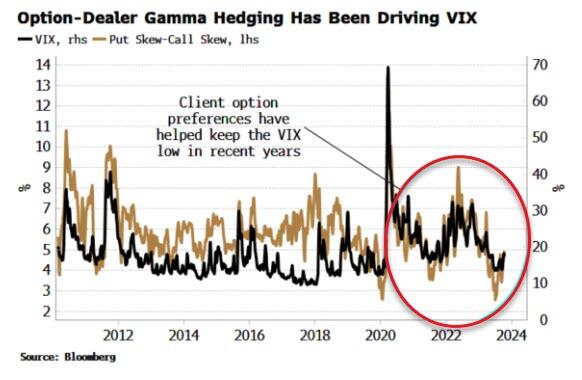
The generally low level of the VIX despite the fastest Federal Reserve rate-hiking cycle yet has been principally driven by the narrowness of the market’s leadership, keeping index implied-correlation low, and by the option preferences of investors.
They have typically been buying out-of-the-money put options and selling out-of-the-money call options, and doing more of the latter. Option dealers gamma hedge their exposure, which most of time represses volatility as they react to moves – selling when the market moves higher, buying when it moves lower – rather than chasing them.
Even when gamma goes negative – indicating a more unstable market and the potential for heightened volatility – the fact that dealers are short rather than long puts, means they eventually have to start buying the market. This is why typically gamma does not stay negative for too long, and bursts higher in volatility have been transient.
Nonetheless, it is unlikely dealers’ gamma hedging can persist in keeping implied and realized equity volatility subdued in the face of a worsening credit cycle in a market for corporates now 78% of GDP.
Price and underlying conditions can diverge, sometimes for significant periods, but financial gravity – fundamentals – always re-asserts itself eventually. That time is approaching for the VIX.