As of 2020, there was a 61.1% likelihood that two people chosen at random will be from different ethnicities in America.
This number comes from the Census Bureau’s Diversity Index, which ranges from 0% to 100% per jurisdiction. A value closer to 0% means that a population is more homogenous, while 100% means that a population has more racial diversity.
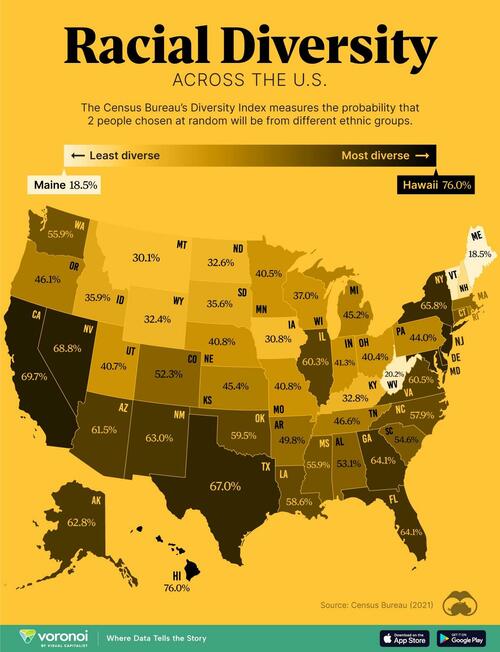
This graphic, via Visual Capitalist's Marcus Lu and Dorothy Nuefeld, maps the most diverse states in the U.S., based on the most recently available data.
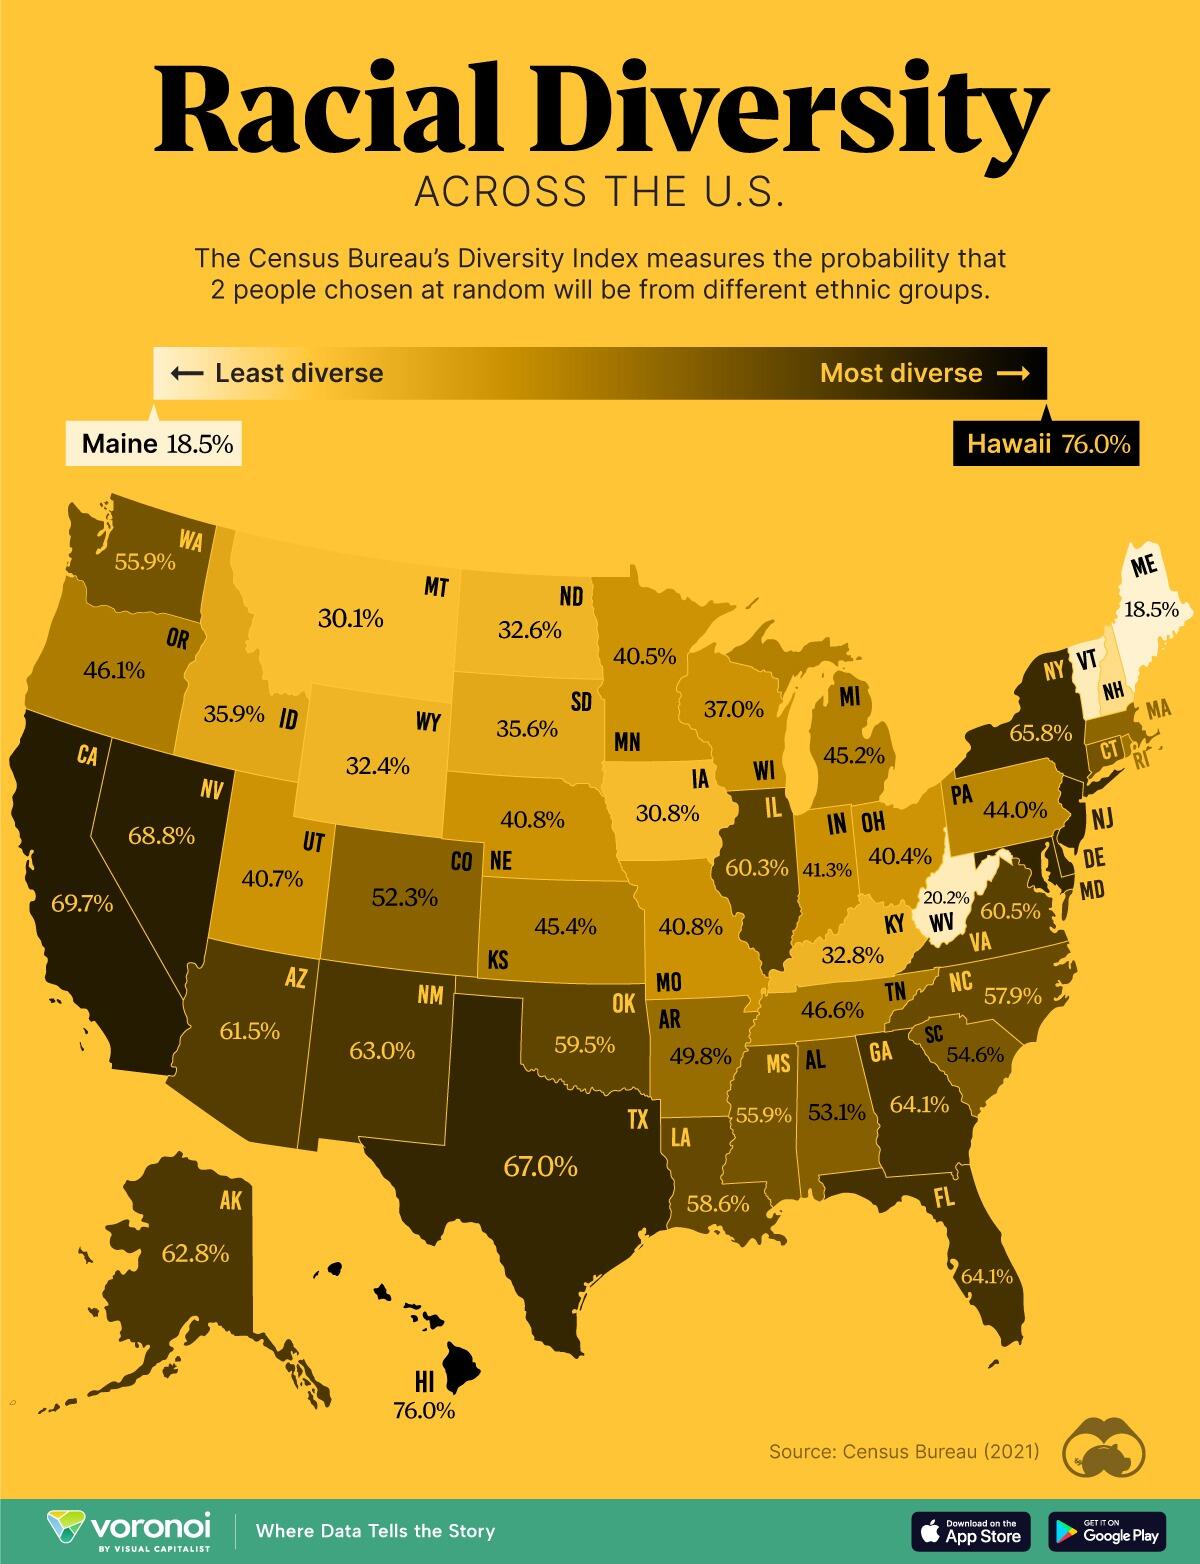
Below, we rank states based on their Diversity Index score in 2020. Each score represents the probability that two people chosen at random will be of different racial or ethnic backgrounds:

In Hawaii, the most diverse U.S. state, 44% of marriages are interracial. Overall, the Hawaiian population is 36.5% Asian, 21.5% white, 10.2% Native Hawaiian or Pacific, and 9.5% Latino or Hispanic.
Meanwhile, California ranks as the second most-diverse state in the country. As the largest ethnic population in the state, Hispanics and Latinos make up 39.4% of residents, followed by 34.7% white, and 15.1% Asian.
In terms of counties, the Aleutians East Borough in Alaska is the most diverse in the country. The least diverse state is Maine, and it also ranks as the oldest state in the country by median age.
Diversity in America, meanwhile, has increased roughly 6% according to the Diversity Index since 2010.