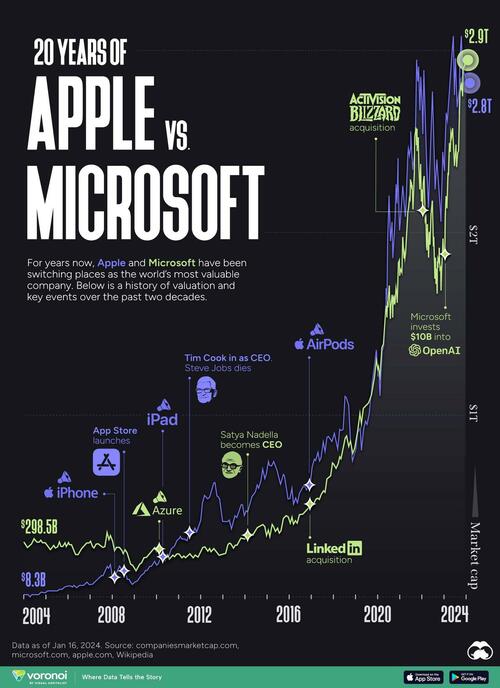
For years, Apple and Microsoft have been switching places as the world’s most valuable company, in terms of market capitalization.
In today’s chart, Visual Capitalist's Nick Routley explores this history, as well as key events over the past two decades, based on data from CompaniesMarketCap and both companies. Data is from January 16, 2024.
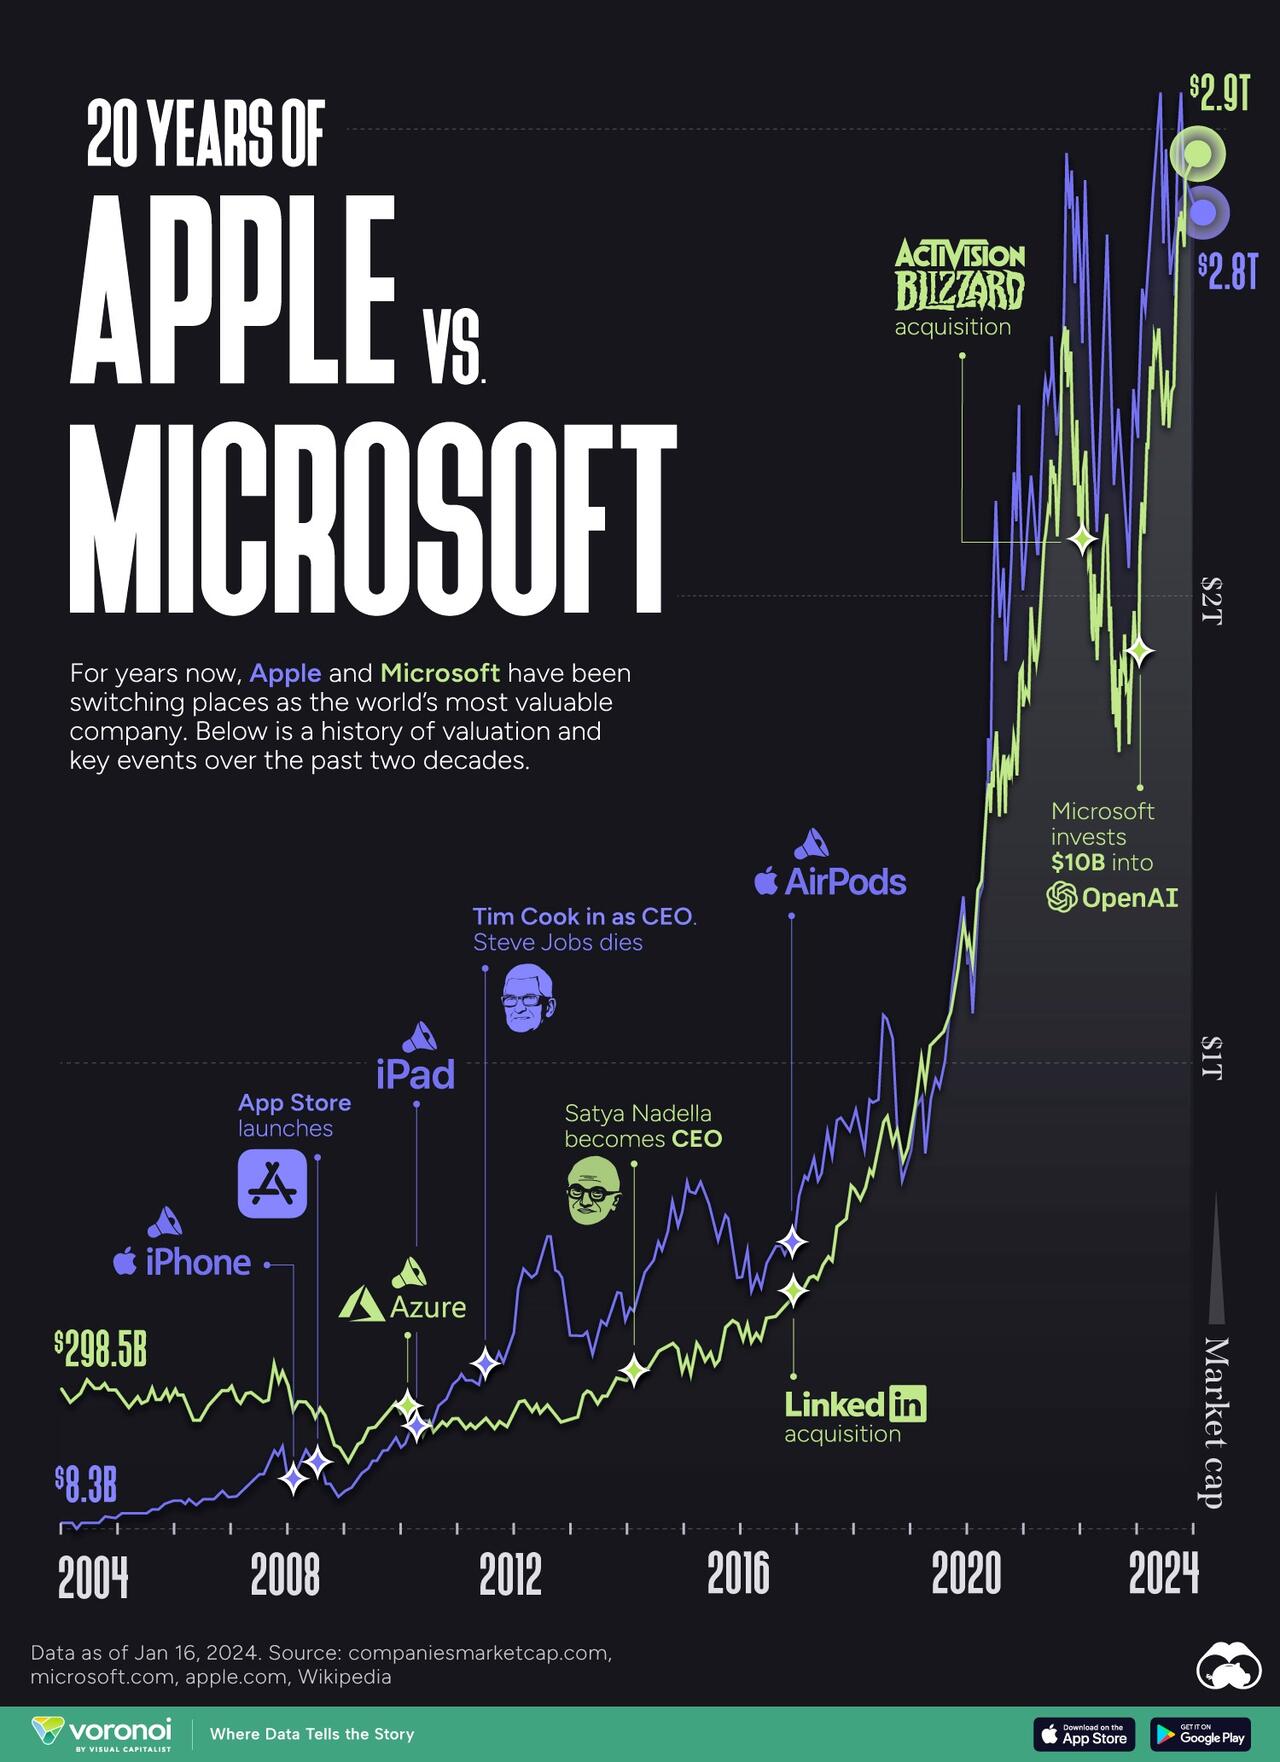
During the 1990s, Microsoft capitalized on the success of Windows, supplanting General Electric as the most valuable company in the U.S. in the process.
Around the same time, Apple was on the brink of bankruptcy due to intense competition in the personal computer market, high product pricing, and a lack of innovation. The company also suffered from numerous failed attempts to modernize the Macintosh operating system (Mac OS) and the failed launches of products like QuickTake digital cameras, PowerCD portable CD, audio players, speakers, and the Pippin video game console.
Over the next decade, however, after the return of Steve Jobs as the CEO, Apple’s stock performance was legendary. This can be attributed to the success of products such as the iMac, iPod, and iPhone, the launch of the famous “Think Different” advertising brand campaign, and opening the Apple Store retail chain.
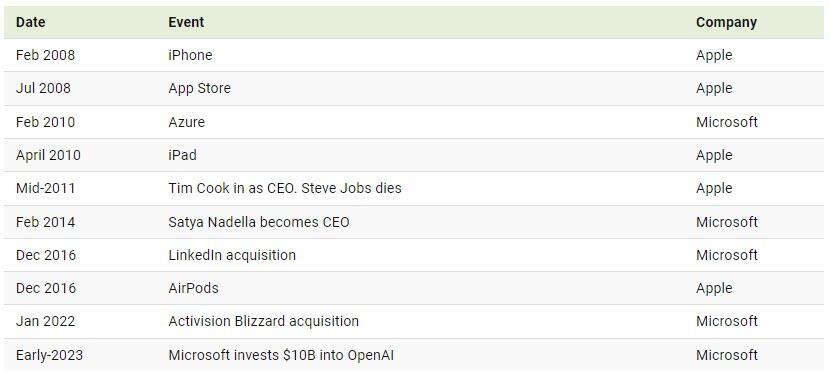
In 2004, Microsoft had a market cap of $291 billion compared to Apple’s $26 billion. By the end of that decade, Apple would reach $297 billion, surpassing its rival ($234 billion).
| Market cap (USD) | Apple | Microsoft |
|---|---|---|
| 2024* | $3.002 T | $3.009 T |
| 2023 | $2.994 T | $2.794 T |
| 2022 | $2.066 T | $1.787 T |
| 2021 | $2.901 T | $2.522 T |
| 2020 | $2.255 T | $1.681 T |
| 2019 | $1.287 T | $1.200 T |
| 2018 | $746.07 B | $780.36 B |
| 2017 | $860.88 B | $659.90 B |
| 2016 | $608.96 B | $483.16 B |
| 2015 | $583.61 B | $439.67 B |
| 2014 | $643.12 B | $381.72 B |
| 2013 | $500.74 B | $310.50 B |
| 2012 | $499.69 B | $223.66 B |
| 2011 | $377.51 B | $218.38 B |
| 2010 | $297.09 B | $234.52 B |
| 2009 | $190.98 B | $268.55 B |
| 2008 | $75.99 B | $172.92 B |
| 2007 | $174.03 B | $332.11 B |
| 2006 | $72.98 B | $291.94 B |
| 2005 | $60.79 B | $271.54 B |
| 2004 | $26.05 B | $290.71 B |
| 2003 | $7.88 B | $295.29 B |
| 2002 | $5.16 B | $276.63 B |
*As of January 2024
Since then, the top spot has been most often held by Apple. The company only fell behind Microsoft in 2018 when concerns about COVID-driven supply chain shortages affected the iPhone maker’s stock price.
More recently, the Apple vs. Microsoft race was shaken up once again. Microsoft became the world’s most valuable company in January 2024, after the rival iPhone maker’s shares had a weak start to the year due to growing concerns over demand in China.
Microsoft’s shares have also been strongly buoyed by the company’s early lead in generative artificial intelligence, mainly thanks to its early investment in ChatGPT-maker OpenAI.