As usual I’d like to preface all this that I write these blogposts as attempts to make sense of a subject for my own sake. I am not an expert here and it is likely I am confused about some details. On the other hand, I think “confused” discourse can also be productive to read and participate in. Being confused is just the first step towards being unconfused, to paraphrase Jake The Dog.
p-value circling
100 years ago this year Fisher arbitrarily suggested using p < 0.05 as a cut-off for “significant” and ever since we’ve just gone along with it. “Why is it 0.05?” people have critically asked for one hundred years. Unfortunately “arbitrariness”, as a critique, is only effective if you are able to suggest less a arbitrary value, and despite many efforts to change this the convention has remained.
The act of p-value circling is to look at a p-value that’s significant but close to 0.05 and go: “hm, I don’t know about that…” Perhaps you use a red ballpoint pen to circle it on the print journal you subscribe to in the year 2025. If not, you may underline it with some sort of digital pen technology and share it online.
“Hmm… Suspicious…”
What (potentially) justifies p-value circling?
Before we get into it let’s briefly try to remind ourselves what p-values are even supposed to do. (This will be a brief summary, if you want to learn this for real I recommend reading Daniël Lakens free online textbook, which all this borrows heavily from.)
As far as I’ve understood, Fishers idea about p-values was supplanted by the more rigorous (in terms of statistical philosophy) Neyman-Pearson framework. It is within this framework we find the familiar type 1 and type 2 error rates. Probability is viewed as being about outcomes in a hypothetical scenario where a procedure is repeated many times. You’re actually supposed to set the \(\alpha\) at a level that’s justifiable based on what null hypothesis you’re testing. As far as I’ve understood no one has ever done so, except that one time physicists at CERN decided they wanted to be really sure they didn’t incorrectly claim they found the Higgs boson. Instead everyone just uses the arbitrary convention of \(\alpha = 0.05\).
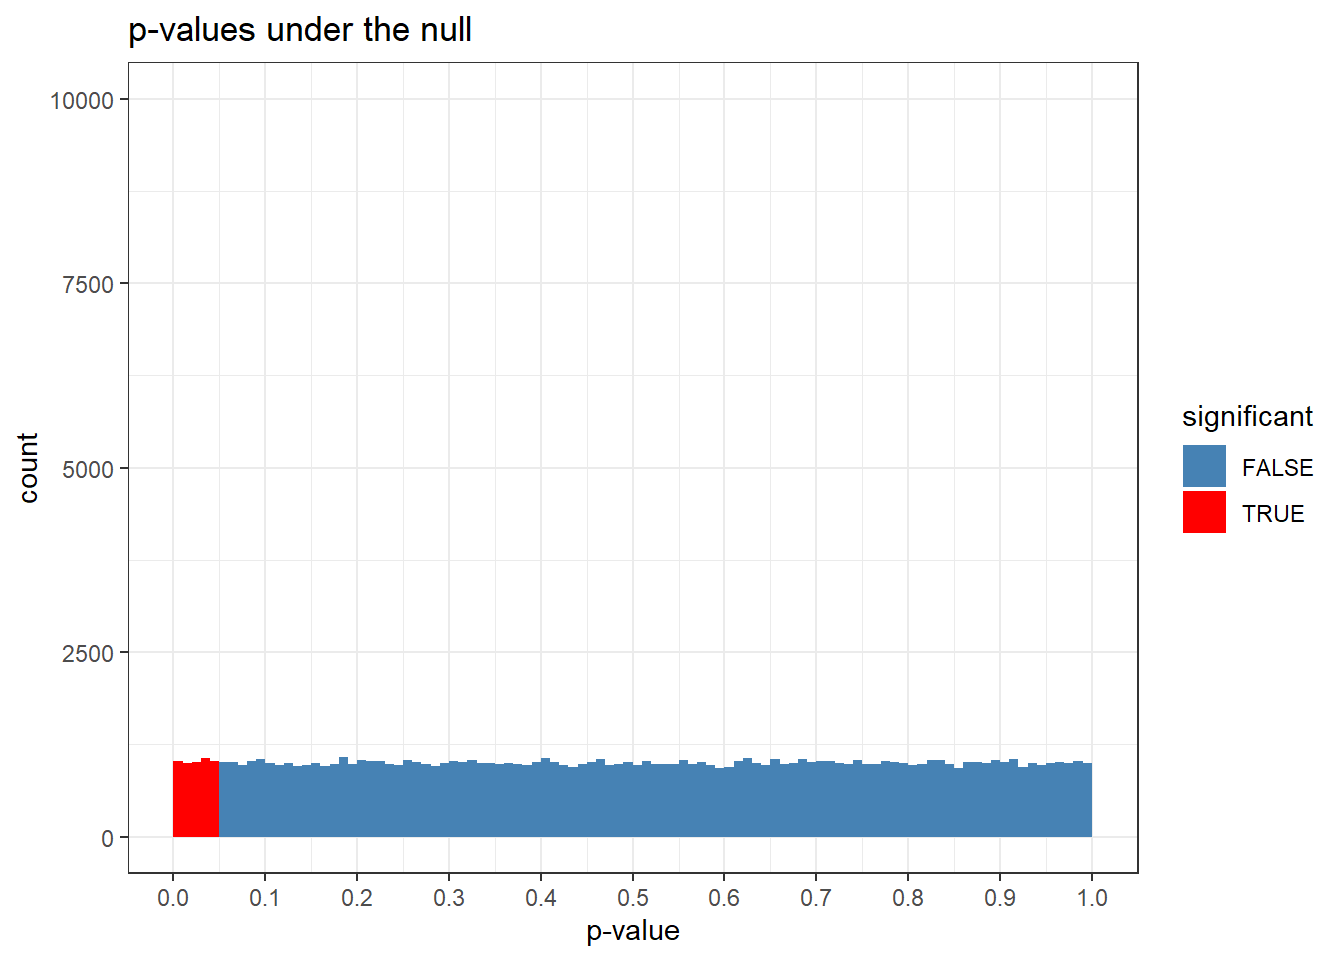
If you assume that the null is true, the p-value distribution is uniform. Let’s do the exercise of generating a hundred thousand t-tests between two groups, n = 100 per group, where there is no mean difference. Then we’ll look at the p-values.
Code
p_vector <-c() #empty vectorfor(i in1:100000){ A <-rnorm(100, 0, 1) #normally distributed data from a group B <-rnorm(100, 0, 1) #another group with same mean p_vector[i] <-t.test(A,B)$p.value}d <-data.frame(p_vector, significant = (p_vector <0.05))ggplot(d, aes(x = p_vector, fill = significant)) +geom_histogram(breaks =seq(0,1, length.out =101), color =NA) +#geom_hline(yintercept = 100000/100) +scale_fill_manual(values =c("FALSE"="steelblue", "TRUE"="red")) +scale_x_continuous(breaks =seq(0,1, by =0.1)) +labs(title ="p-values under the null", x ="p-value", y ="count") +theme_bw() +ylim(0,10000)
I remember this blew my mind when I fist saw it. I don’t think I was surprised exactly; it just made it all click. This flatness is what p-values are all about, man! The p-value distribution is uniform under the null! Yes! It is this property of the distribution that gives meaning to the type 1 error rate.
NP-frequentism is then based on committing to an alpha threshold beforehand and then exclaim “significant!” iff the p-value lands below it.
Does it matter how far below it?
No! If the null is true every p-value is equally likely, right? Your sampling procedure of a null may give you 0.98, or 0.58, or 0.002, or 0.006775892. When you’re focused on whether toreject the (exact) null hypothesis, NP-frequentism works its magic by assuming the null is true which means p=0.01 is not in and of itself less consistent with this assumption than a p=0.048. If the null was true, you just got handed a random number between 0 and 1. All you get to choose is often you want to mistakenly “act” upon this information (in the long run).
So, how is this supposed to justify p-value circling? Well p-values are only valid if they’re valid. P-values only care about sampling error and – being an inert mathematical abstraction – can’t by themselves handle questionable research practices like p-hacking done by flesh and blood human researchers.
Let’s set up a scenario where we collect more data if our p-value happens to be not significant, but stop collecting data if it is. We’ll add a one-time option to include 20 more participants.
Code
p_vector <-c() #empty vectorfor(i in1:100000){ A <-rnorm(100, 0, 1) #normally distributed data from a group B <-rnorm(100, 0, 1) #another group with same meanif(t.test(A,B)$p.value >0.05){ A <-append(A, rnorm(20, 0, 1)) B <-append(B, rnorm(20, 0, 1)) } p_vector[i] <-t.test(A,B)$p.value}d <-data.frame(p_vector, significant = (p_vector <0.05))ggplot(d, aes(x = p_vector, fill = significant)) +geom_histogram(breaks =seq(0,1, length.out =101), color =NA) +geom_hline(yintercept =100000/100) +scale_fill_manual(values =c("FALSE"="steelblue", "TRUE"="red")) +scale_x_continuous(breaks =seq(0,1, by =0.1)) +labs(title ="p-values when p-hackning", x ="p-value", y ="count") +theme_bw() +ylim(0,10000)
As you can see there’s now a little bump in what was previously flat. Some “marginally significant” p-values got lucky and grew a bit. The bin between 0.05 and 0.06 shrunk the most. Notably there’s a tilted shape to the significant values now.
It is this shape, this knowledge that you can fudge p-values a little bit that I think could maybe give some justification to the act of p-value circling. Maybe. In that case a p = 0.048 makes people think: “hmm, I bet that was 0.051 and they strategically removed an outlier or something”
I don’t think it’s a very strong justification for being suspicious of p-values between 0.04 and 0.05. Part of this depends on how prevalent you believe p-hacking is. Basically you’re saying “my personal significance level is set a bit lower than convention, because I think the p-values I see are distorted by p-hacking”. I think that’s probably fine as an epistemic habit, but as an author getting p-circled it would likely feel as an unfair criticism.
sort(p_vector)[5000] #a suggestion, in this scenario
Even so, in this scenario I set up here there’s more additional spurious p-values below 0.04 than between 0.04 and 0.05. P-values are fickle things, they dance around, so even if you think the practice is common I don’t think you should put a lot of weight in the idea that whatever questionable statistical jutstu a researcher does to avoid a null result will put their (hacked) p-value just below the threshold.
Basically I don’t think a single p-value in and of itself can carry a lot of information about statistical malpractice. I’m sympathetic to the rule that if you’ve ever scoffed at someone using the term “marginally significant”, you’re not allowed to call something “marginally insignificant”.
Lindley’s paradox
A potentially more sophisticated justification for p-circling is “Lindley’s paradox.”
I think many instinctively feel some resistance to a very strict interpretation of p-values, where their sole function is to be uniform under the null and the thing we care about is whether they clear our pre-specified alpha level. After all, we rightfully get annoyed when p-values are reported only with a less-than sign. And should we really not feel confident that there’s something there when we see a p = 0.001?
In this group-difference setup a smaller p-value implies a larger mean difference in your sample means, and you’re more likely to come across a large mean difference if you happen to be in a universe where there truly is a difference between the groups.
Let’s see how it looks like when we have a difference between the groups.
Code
p_vector <-c() #empty vectorfor(i in1:100000){ A <-rnorm(100, 0, 1) #normally distributed data from a group B <-rnorm(100, 0.2, 1) #another group with same mean p_vector[i] <-t.test(A,B)$p.value}d <-data.frame(p_vector, significant = (p_vector <0.05))ggplot(d, aes(x = p_vector, fill = significant)) +geom_histogram(breaks =seq(0,1, length.out =101), color =NA) +geom_hline(yintercept =100000/100) +scale_fill_manual(values =c("FALSE"="steelblue", "TRUE"="red")) +scale_x_continuous(breaks =seq(0,1, by =0.1)) +labs(title =paste("p-values when power =",round(sum(p_vector <0.05)/100000, 2)), x ="p-value", y ="count") +theme_bw() #+ ylim(0,10000)
The sum of red colored p-values now represent power. Notice the switch! I think this may be a source of confusion here. We are now looking at a different type of p-value distribution. A p-value distribution that is not meant to illustrate the meaning of p-values. Power or type 2 error is, fundamentally, something else. It’s a different type of error.
When I fist saw this my mind immediately jumped to the idea of some p-values being “more consistent with the presence of an effect”. This is a bit off according to strict NP-frequentism; again, p-values get their meaning from assuming the null is true. Here we instead assume some effect is true.
The line represents where p-values would end up under the null. At this power, p-values in the 0.04 to 0.05 bin are more likely than they would be if the null was true. If we raise the power even further, we get to “Lindley’s paradox”, the fact that p-values in this bin can be less likely then they are under the null.
Code
p_vector <-c() #empty vectorfor(i in1:100000){ A <-rnorm(100, 0, 1) #normally distributed data from a group B <-rnorm(100, 0.55, 1) #another group with same mean p_vector[i] <-t.test(A,B)$p.value}d <-data.frame(p_vector, significant = (p_vector <0.05))ggplot(d, aes(x = p_vector, fill = significant)) +geom_histogram(breaks =seq(0,1, length.out =101), color =NA) +geom_hline(yintercept =100000/100) +scale_fill_manual(values =c("FALSE"="steelblue", "TRUE"="red")) +scale_x_continuous(breaks =seq(0,1, by =0.1)) +labs(title =paste("p-values when power =",round(sum(p_vector <0.05)/100000, 2)), x ="p-value", y ="count") +theme_bw() #+ ylim(0,10000)
It’s kind of hard to see, since so many p-values end up in the 0-0.01 bin. Let’s zoom in on only the bins between 0.03 and 0.10.
Code
d <-subset(d, p_vector >0.03& p_vector <0.1)ggplot(d, aes(x = p_vector, fill = significant)) +geom_histogram(breaks =seq(0.03,0.1, length.out =8), color =NA) +geom_hline(yintercept =100000/100) +scale_fill_manual(values =c("FALSE"="steelblue", "TRUE"="red")) +scale_x_continuous(breaks =seq(0.03,0.1, by =0.1)) +labs(title =paste("p-values when power =",round(sum(p_vector <0.05)/100000, 2)), x ="p-value", y ="count") +theme_bw() #+ ylim(0,10000)
As you can see, the 0.04 to 0.05 bin is now below the line which represents the ideal flat null distribution. This then is (potentially) another reason to justify p-value circling: If a test has a lot of power, coming across a p-value close to threshold is surprising. Almost all p-values are to the left of it. We even had to zoom!
It is here, I think, we get to a second source of confusion. I’ve noticed that a lot of psychologists think of power as N. We think “if we increase the sample size we increase power”. This is true, but we have to remind ourselves that power is always for a potential true effect. If there is no effect, increasing N can’t increase power.
I think it’s therefore more helpful (for the present discussion of p-value circling) to think of increasing power as “increasing which effect we assume to be true”. Stated that way, p-value circling based on Lindley’s paradox seems a bit strange, as if you’re saying:
“The p-value reported here would be rare if the true effect was such that we had ~97% power to detect it, which convinces me that the null is true.”
I don’t think that makes sense! Why are you assuming that particular true effect? Surely, there’s a potential true effect where the likelihood of the observed p-value is similar to its likelihood under the null? (For the 0.04 to 0.05 bin this appears to be around 95% power). Also, I think it unfairly imposes a role on p-values that they’ve not been hired to play. P-values are not meant to be a measure of evidence – not in that direct way at least. They are meant to give stable error rates when the null is true. This contrasting between the plausibility of seeing a p-value under a null hypothesis versus a specific alternative hypothesis isn’t what they were designed for.
Ok but it seems possible to use them that way? One could specify a smallest effect size of interest and compare the plausibility of seeing the reported p-value under that distribution compared to the null distribution. Maier and Lakens (2022) suggest you could do this exercise when planning a test in order to justify your choice of alpha-level. However, I doubt this structured approach is what lies behind the casual circling of p-values I’ve come across online over the years. My impression is that most social media p-circling haven’t been studies with very high power to detect small effects.
There is a concern that very large studies may pick up on “noise”, or that other violations of model assumptions (e.g. normality) tend to bias p-values downward. I don’t really know what to make of these concerns. I think that might be true for some model violations, while other may hurt power instead. I would assume it’s a complicated empirical question whether the statistical models we use tend to misfit reality more in one direction rather than the other.
Regardless, I don’t think it can be salvaged as a ground for being skeptical of p-values close to their threshold because of Lindley’s paradox.
For the moment I feel safest treating the conventional threshold as what it is, as arbitrary as that is. I’m of course concerned about QRPs and p-hacking, but I don’t see a reason for why a single p-value close to 0.05 would be useful evidence of it.
Some concluding thoughts
As I prefaced, this is complicated stuff and I have probably gotten something wrong. Regarding the larger question on whether p-values can be interpreted as evidence, I currently land in the conclusion “not in and of themselves”, they have to be contextualized in relation to power and other features of the study, as well as the context you come across them in. Lindley’s paradox can be a useful illustration of one of the reasons that the interpretation isn’t straight-forward (but I don’t think it justifies p-circling).
On the other hand, I know that smarter and more well-read people than I disagree on how straightforward this interpretation is. The textbook we used in my PhD-level course in medical statistics contain a table that tells us to do that:
hmm..
I don’t think it’s quite that simple. My current understanding (given Lindley’s paradox) is that evidence has to be “relative”, in some sense. P-values only tell one side of the story, and are only made to tell one side of the story. If you want a statistic that expresses the strength of evidence you should probably use something else, e.g. Bayes factors.
Links etc:
I didn’t look up a lot of things for this post, it was more an attempt to think through my current understanding, but if you want to play around with visualizations of the p-value distribution I warmly recommend Kristoffer Magnussons interactive thingy: https://rpsychologist.com/d3/pdist/
See Daniel Lakens book for a real introduction to p-values. It’s there and the associated coursera course I learned about this stuff in the first place. I also always recommend Zoltan Dienes book Understanding Psychology As A Science (2008), which has also formed my understanding a lot.
See also Maier and Lakens (2022) for a structured approach to compromise between Lindeley’s paradox and the NP frequentist perspective.
I am serious. If you think I’m misunderstanding something badly or you just want to discuss or you want to gently point me in the right direction: Please tell me what I’m missing. I don’t have a comment section on this blog, but I’ll post this on bluesky and then update this post to link the post that links this post: Here is the link.
So if you want you can comment, do it over there, or send me an e-mail.