I recently worked on https://github.com/ClickHouse/ClickHouse/pull/87366. The idea is simple but learned a lot of ClickHouse aggregation, so want to jot it down.
Background
The original issue stated it clear, if you run almost identical queries, their performances varies a lot!
milovidov-pc :) SELECT number % 10000 AS k, uniq(number) AS u FROM numbers_mt(1e9) GROUP BY k ORDER BY u DESC LIMIT 10

SELECT
    number % 10000 AS k,
    uniq(number) AS u
FROM numbers_mt(1000000000.)
GROUP BY k
ORDER BY u DESC
LIMIT 10

Query id: d3e22e17-1a32-4615-bf1a-a2da6e0510eb

    ┌────k─┬──────u─┐
 1. │ 4759 │ 101196 │
 2. │ 4587 │ 101079 │
 3. │ 6178 │ 101034 │
 4. │ 6567 │ 101032 │
 5. │ 9463 │ 101013 │
 6. │  298 │ 101009 │
 7. │ 2049 │ 100993 │
 8. │ 8167 │ 100989 │
 9. │ 5530 │ 100973 │
10. │ 1968 │ 100973 │
    └──────┴────────┘

10 rows in set. Elapsed: 62.793 sec. Processed 1.00 billion rows, 8.00 GB (15.93 million rows/s., 127.40 MB/s.)
Peak memory usage: 11.30 GiB.

milovidov-pc :) SELECT 0 + number % 10000 AS k, uniq(number) AS u FROM numbers_mt(1e9) GROUP BY k ORDER BY u DESC LIMIT 10

SELECT
    0 + (number % 10000) AS k,
    uniq(number) AS u
FROM numbers_mt(1000000000.)
GROUP BY k
ORDER BY u DESC
LIMIT 10

Query id: e6a24292-54cf-47cb-8e39-81584736d41a

    ┌────k─┬──────u─┐
 1. │ 4759 │ 101196 │
 2. │ 4587 │ 101079 │
 3. │ 6178 │ 101034 │
 4. │ 6567 │ 101032 │
 5. │ 9463 │ 101013 │
 6. │  298 │ 101009 │
 7. │ 2049 │ 100993 │
 8. │ 8167 │ 100989 │
 9. │ 5530 │ 100973 │
10. │ 1968 │ 100973 │
    └──────┴────────┘

10 rows in set. Elapsed: 8.547 sec. Processed 1.00 billion rows, 8.00 GB (116.99 million rows/s., 935.95 MB/s.)
Peak memory usage: 10.09 GiB.- The only difference is that second query is using
0 + (number % 10000)for the group by valuek. - ClickHouse treats the k as UInt16 in first query and UInt64 (or other types that UInt16).
But why this matters? Let's delve into the aggregation technical details a bit in ClickHouse.
How Aggregation Works
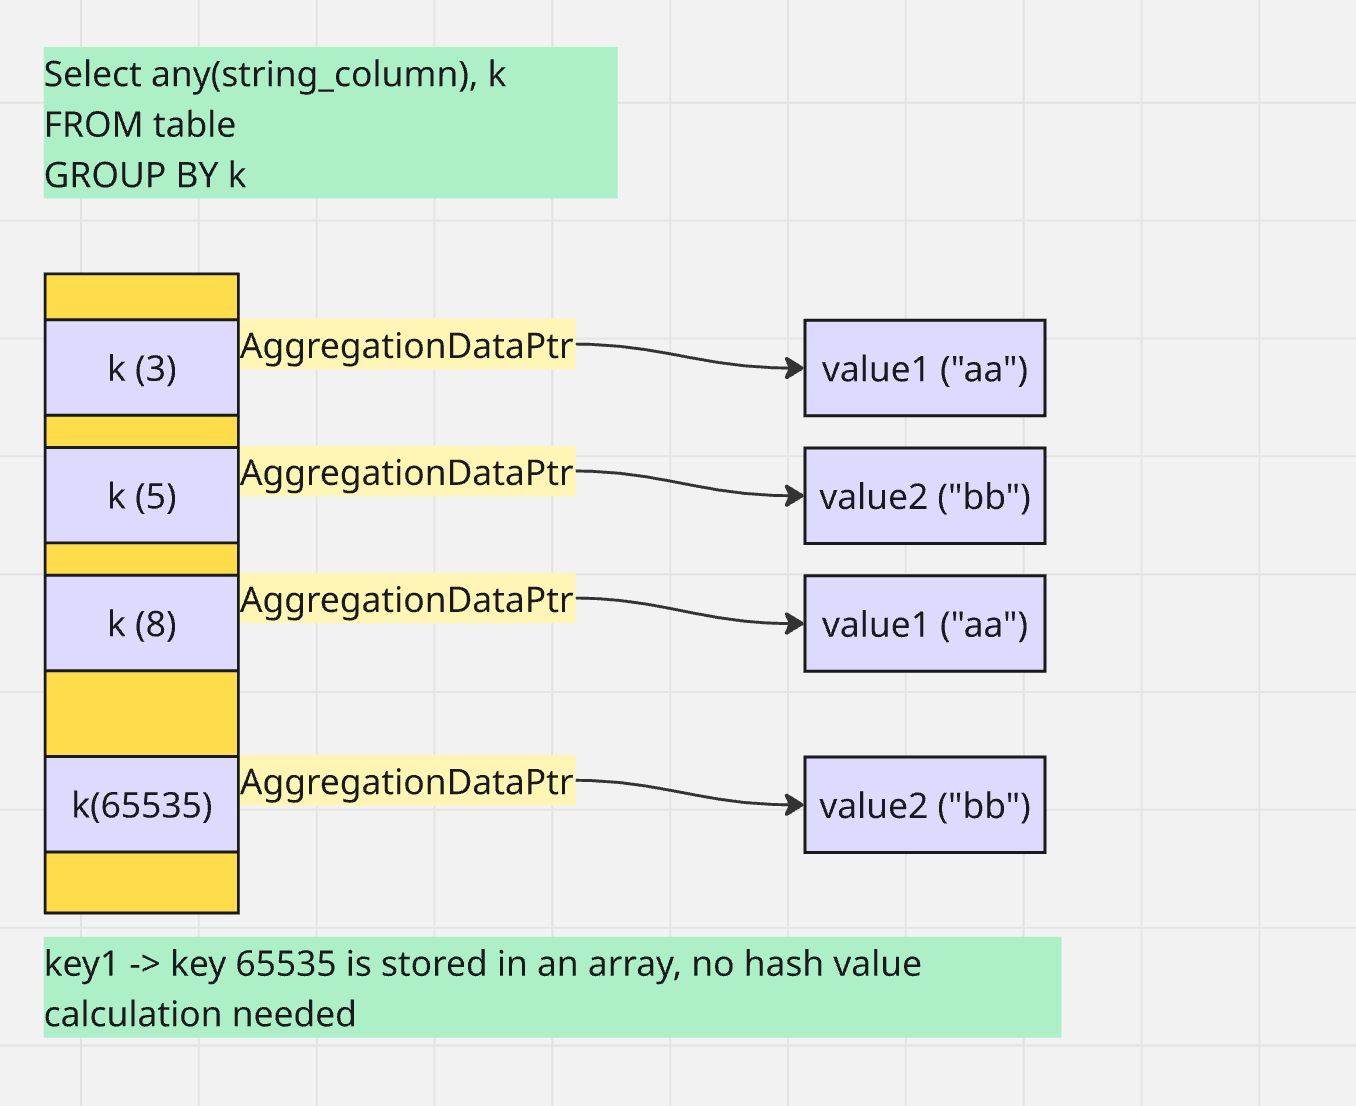
When group by a number smaller than UInt16, could use array for hashmap.
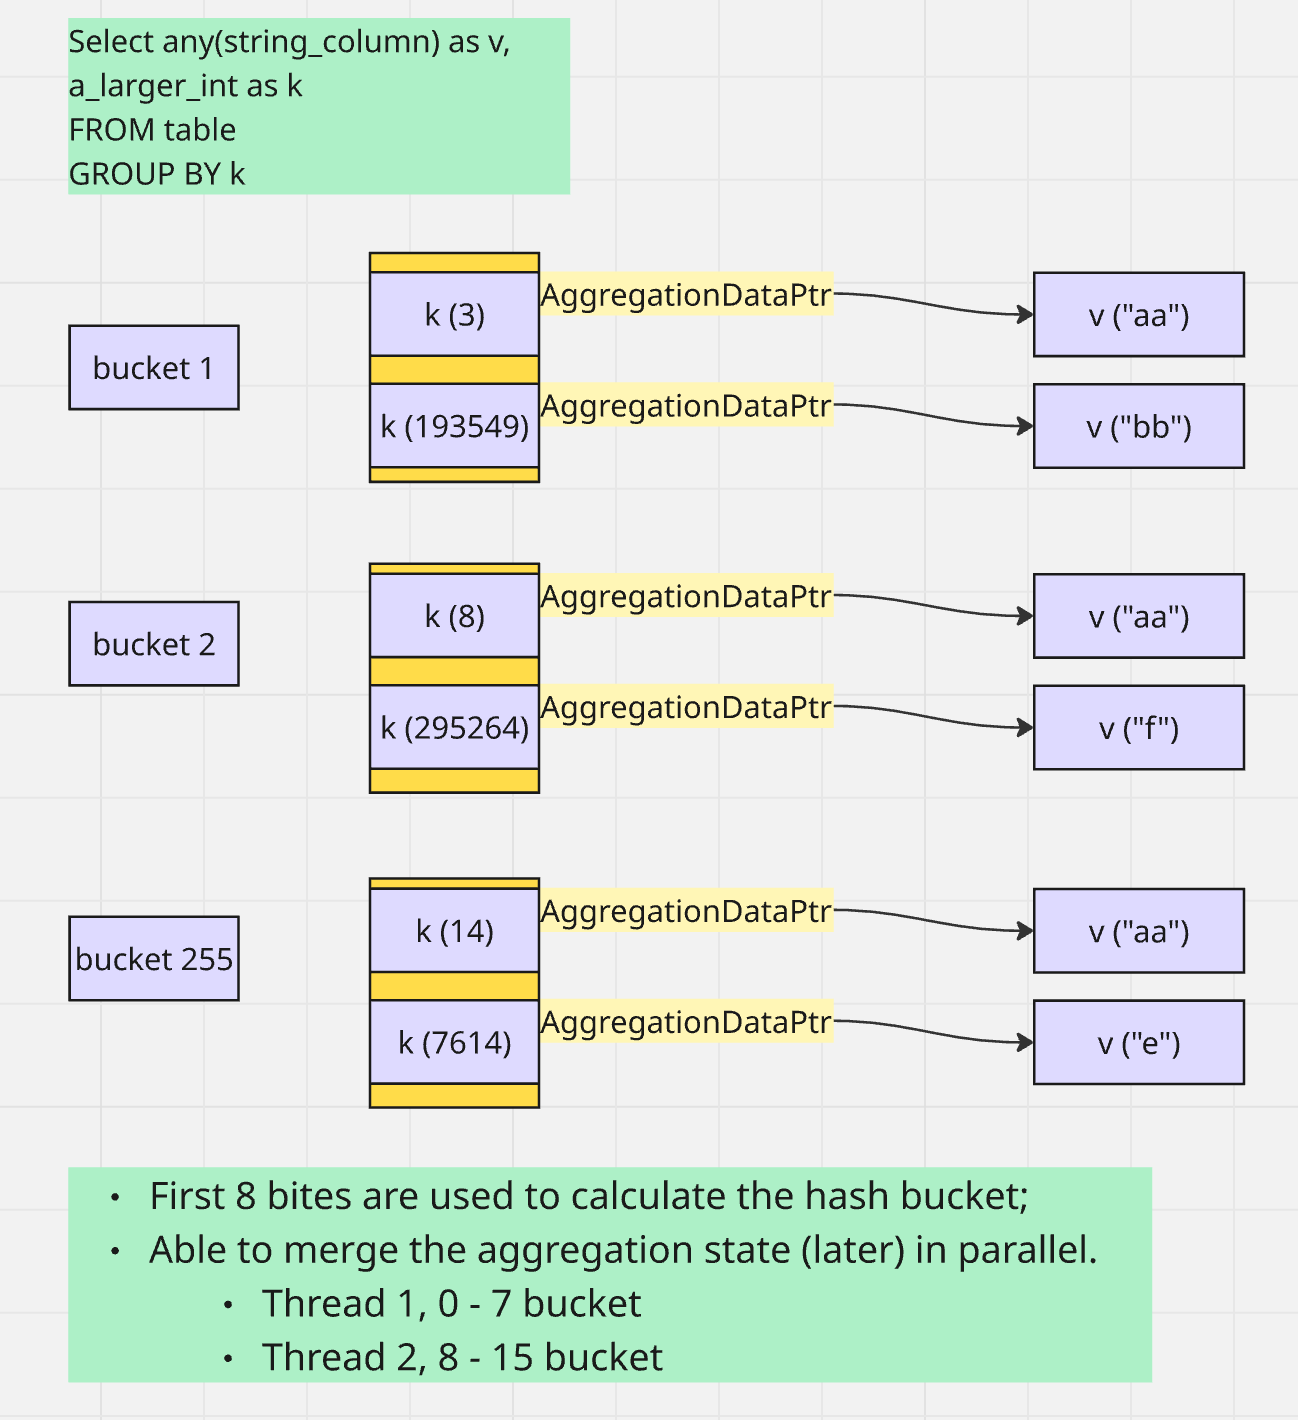
Otherwise use standard hash map, and potentially converted to two level hash map
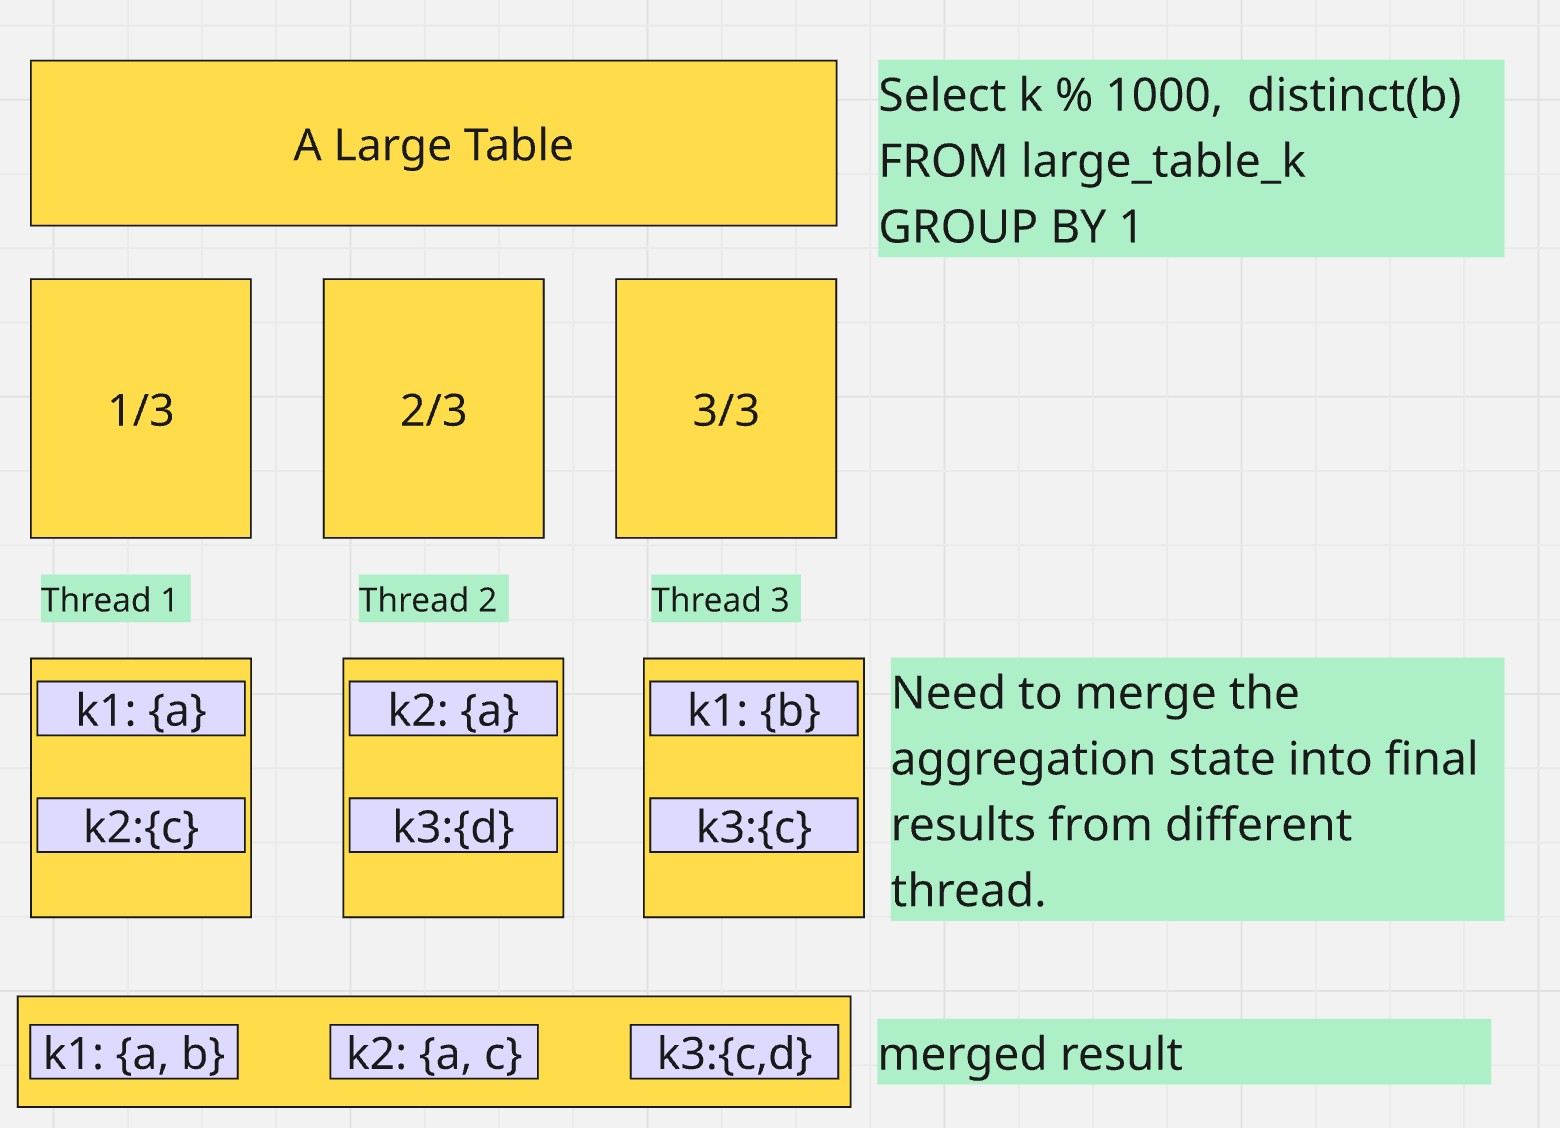
What does it mean for merging the aggregation state?
Now it's clear why first query is slow
- when each thread has a two level hash table. Merge can be parallel: T1 works on 0-7 bucket, and T2 8-15, etc.
- When fixed hash map is used, every aggregation state is stored in a single one dimension array. Such bucket based parallel merge is not possible.
Improvement
- Initial idea is to convert the one dimension array to two level, but that turns out to be slow.
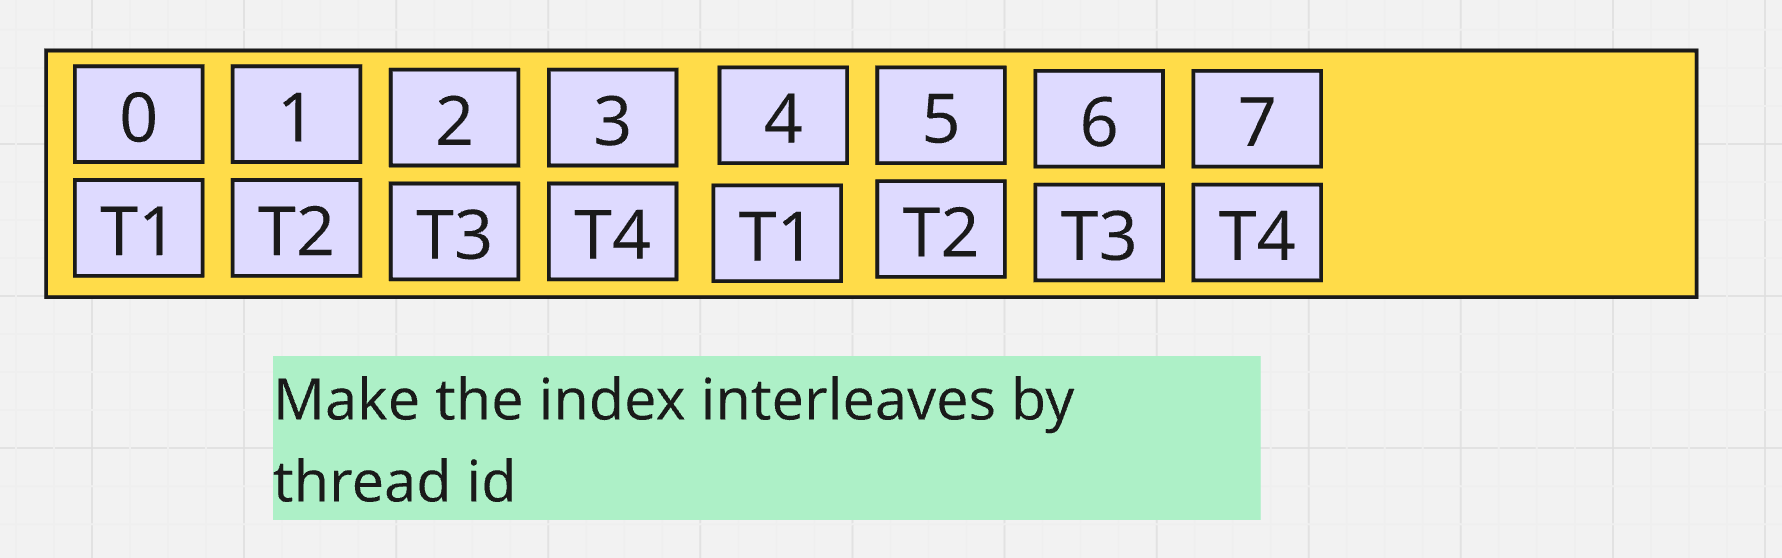
- Nikita T. proposed the idea: let the each merge worker thread working on disjoint subsets of the group by keys in-place, no race condition, no conversion needed.
- Hence my implementation. But still lots of to learn.
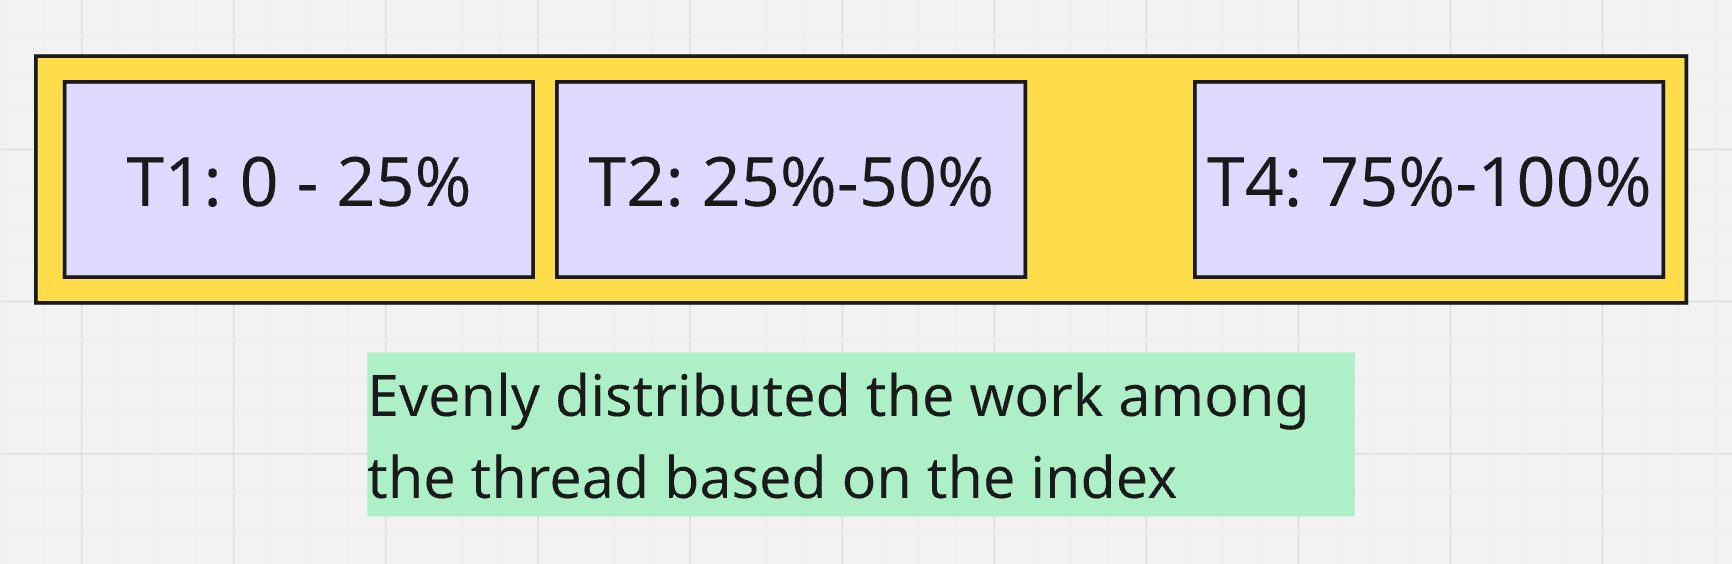
Range based segmentation not working well
The first intuitive idea is to segment the keys into different range.
Faster but not so much. Flamegrapah remains the same! Because while the wall clock time is different due to parallelism, the CPU time for the stacktrace is the same. You can't figure it out by looking at stack trace. I figured this out via logging and checking timespent along with the thread id.
Once knowing this, I decided to distribute the merge work to differently.
Weird memory corruption error
At one point CI fails with errors from memory deallocation. Certain assertions checks of the size failed.
2025.09.22 01:04:58.132587 [ 906517 ] {} <Fatal> BaseDaemon: 10. /home/incfly/workspace/github.com/ClickHouse/ClickHouse/src/Common/Exception.h:58: DB::Exception::Exception(PreformattedMessage&&, int) @ 0x000000000b549785
2025.09.22 01:04:58.243209 [ 906517 ] {} <Fatal> BaseDaemon: 11. /home/incfly/workspace/github.com/ClickHouse/ClickHouse/src/Common/Exception.h:141: DB::Exception::Exception<unsigned long&>(int, FormatStringHelperImpl<std::type_identity<unsigned long&>::type>, unsigned long&) @ 0x000000000bce6cab
2025.09.22 01:04:58.248715 [ 906517 ] {} <Fatal> BaseDaemon: 12.0. inlined from /home/incfly/workspace/github.com/ClickHouse/ClickHouse/src/Common/Allocator.cpp:119: (anonymous namespace)::checkSize(unsigned long)
2025.09.22 01:04:58.248738 [ 906517 ] {} <Fatal> BaseDaemon: 12. /home/incfly/workspace/github.com/ClickHouse/ClickHouse/src/Common/Allocator.cpp:144: Allocator<false, false>::free(void*, unsigned long) @ 0x000000001272c82e
2025.09.22 01:04:58.265559 [ 906517 ] {} <Fatal> BaseDaemon: 13. /home/incfly/workspace/github.com/ClickHouse/ClickHouse/src/Common/Arena.h:94: DB::Arena::MemoryChunk::~MemoryChunk() @ 0x000000000c8858a2
2025.09.22 01:04:58.281901 [ 906517 ] {} <Fatal> BaseDaemon: 14.0. inlined from /home/incfly/workspace/github.com/ClickHouse/ClickHouse/contrib/llvm-project/libcxx/include/__memory/unique_ptr.h:80: std::default_delete<DB::Arena::MemoryChunk>::operator()[abi:se190107](DB::Arena::MemoryChunk*) const
2025.09.22 01:04:58.281922 [ 906517 ] {} <Fatal> BaseDaemon: 14.1. inlined from /home/incfly/workspace/github.com/ClickHouse/ClickHouse/contrib/llvm-project/libcxx/include/__memory/unique_ptr.h:292: std::unique_ptr<DB::Arena::MemoryChunk, std::default_delete<DB::Arena::MemoryChunk>>::reset[abi:se190107](DB::Arena::MemoryChunk*)
2025.09.22 01:04:58.281931 [ 906517 ] {} <Fatal> BaseDaemon: 14.2. inlined from
I have no clue how the memory management gets into trouble from my changes. Reading the code, I found DB::Arena is a very interesting technique for memory management.
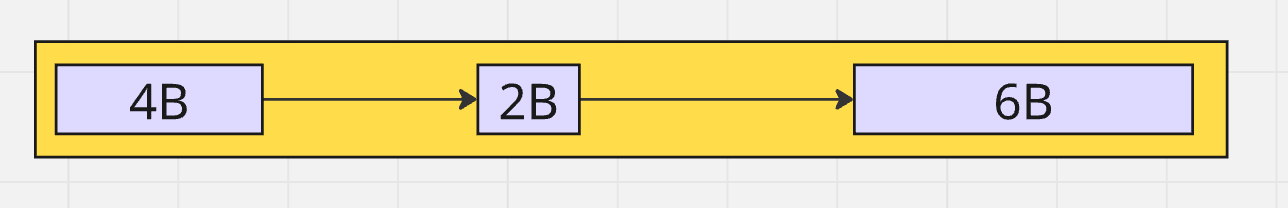
Imagine you need to create lots of small sized string in a query execution for intermediate results (such as our aggregation state). They are short lived and would be all removed together. Traditional way to handle that would be maintaining a region of free memory and bookkeep the allocated and free memory regions using a linked list.
DB::Arena however, just using a single offset index variable to record the next free memory location. Every time when allocating sized M bytes, Arena just returns offset as pointer and increment by M.
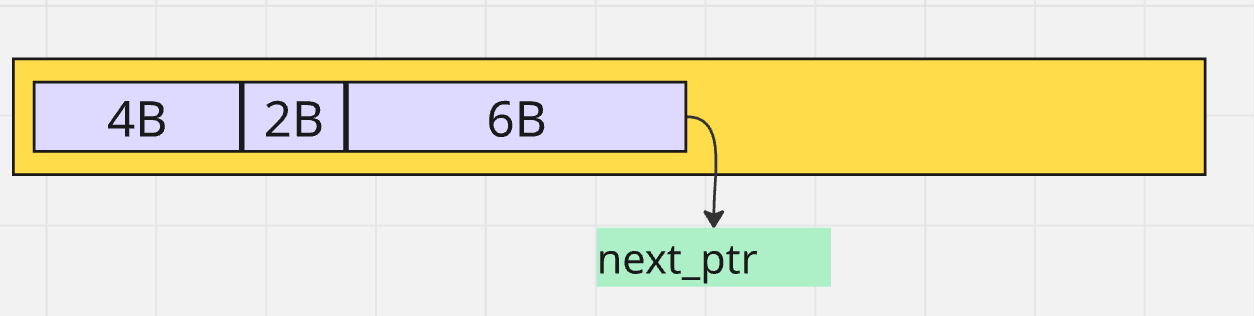
- This is extremely fast: no traversal to find slot.
- Cannot free individual memory which is fine to this use case, as all objects would be deallocated together. Just free the entire Arena region.
Come back to my issue. I noticed a few different but related failures
- Running large number of aggregation can ended up with segmentation fault, stack trace also showing from relevant Arena code.
- Query results can also be wrong sometimes.
All these pointed out to the race condition of the memory allocation. Re-checking the code, Arena is not thread safe and existing two level aggregation uses one Arena per thread during merge. Fixing my mis-usage of using the same Arena, resolves the issue.
Trivial count/select performance degrade
Make aggregate state merge parallel for key8 and key16. by incfly · Pull Request #87366 · ClickHouse/ClickHouse
Signed-off-by: Jianfei Hu [email protected] #63666 Implemented the idea from #63667 (comment) Adds a method mergeToViaIndexFilter to FixedHashMapCreate multiple worker during pipeli...
I found that if I replace aggregation function to trivial ones such as count/sum/min/max in the example query above, not only it does not speed up but even become slower. I figured it would because the overhead of parallel merge cannot be justified when the merge work itself is too trivial. Therefore I disabled the optimization for those cases.
However reviewer carefully point out that we should try to understand the reason:
- Fixed hash map records a min / max index to speed up iterations and other operations. We disabled that to avoid race condition.
- This means that we have to iterate the whole array instead of the ones that is populated, imagine
k % 100. - All slowed down queries are slowed down by the same amount of time, 3ms always.
Solution: extract the min/max index before parallel merge to limit the range of iteration.
Misc. technical details
ClickHouse CI performance test provides differential flame graph. This is how we identify the introduced small perf penalty. In example below:

FixedHashMap.h:123# Aggregator::mergeDataImplwas identified slight increase. This points to theisZerofunction. But why still annotated with Aggregator function? Some compiler trick recognized while being inlined in the same function the original source code is still in another file.- I still don't fully understand why the new function
mergeSingleLevelDataImplFixedMapand others are identified as white. Some tricks in the flamegraph differential calculation.