The top 10% owns 87% of the stocks in this country.
They also own 84% of the private businesses, 44% of real estate and two-thirds of overall wealth.
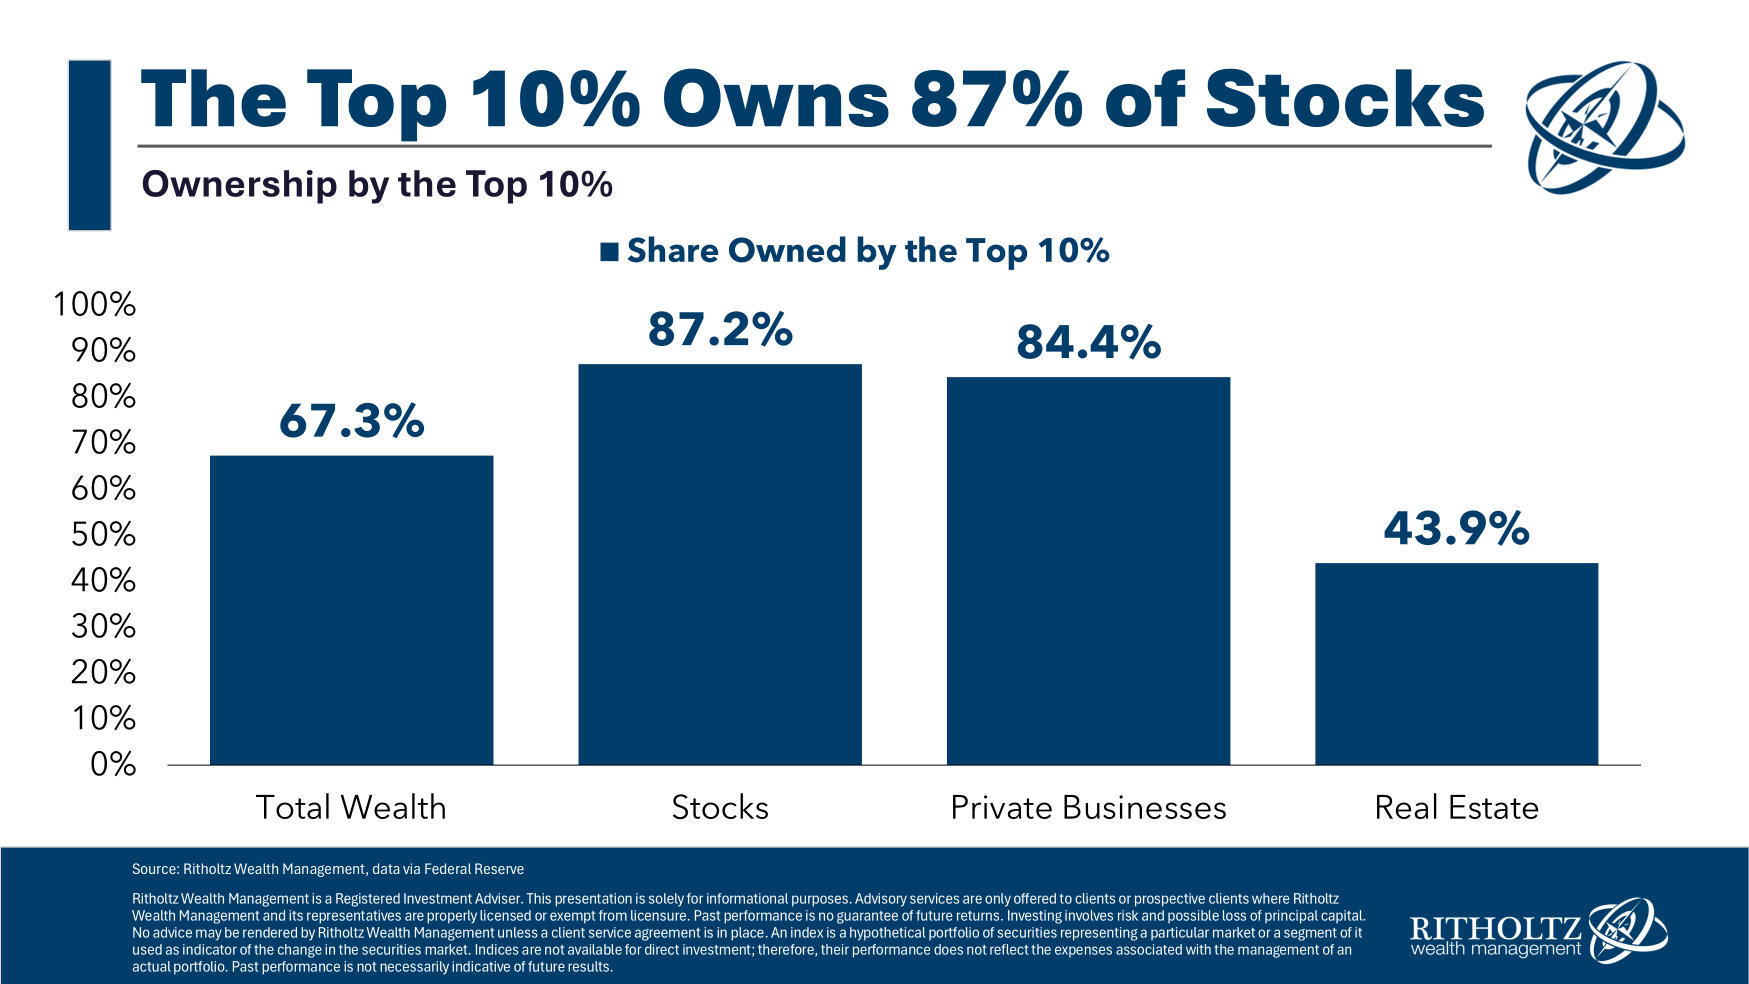
These numbers have all increased since 1989 as well — total wealth (60.8% to 67.3%), stocks (81.7% to 87.2%), private businesses (78.4% to 84.4%) and real estate (38.2% to 43.9%).
According to The Wall Street Journal, the top 10% also accounts for 50% of all consumer spending:
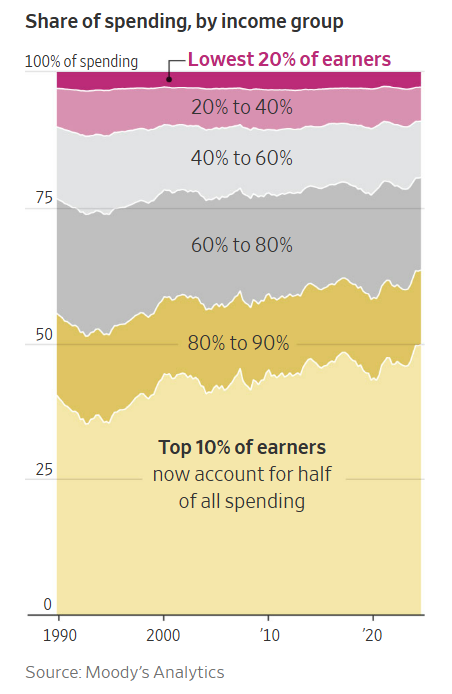
Three decades ago the top 10% made up 36% of spending.
It’s accelerating this decade:
Between September 2023 and September 2024, the high earners increased their spending by 12%. Spending by working-class and middle-class households, meanwhile, dropped over the same period.
The bottom 80% of earners spent 25% more than they did four years earlier, barely outpacing price increases of 21% over that period. The top 10% spent 58% more.
The top 10% is spending way more on an inflation-adjusted basis in the 2020s.
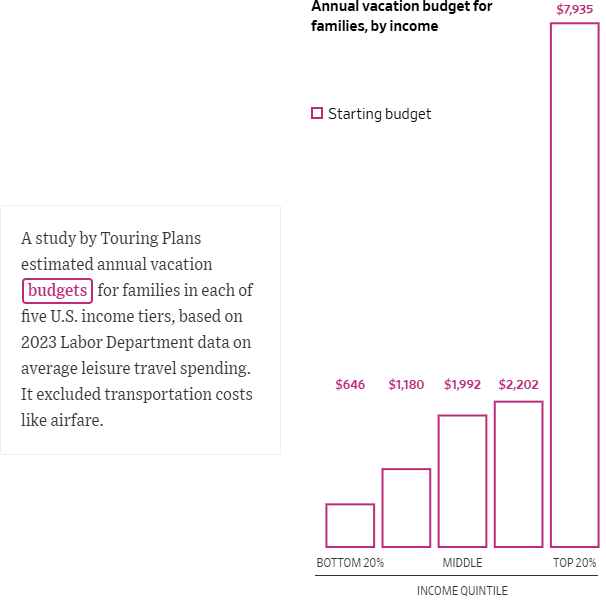
Look at the travel budget for the wealthiest household (via another piece from the WSJ):
The wealthy class exist in a different stratosphere and there are wide-ranging implications here:
Concentration is everywhere. The stock market is concentrated. So is the economy. This concentration could make markets and the economy riskier but it also makes them harder to handicap.
When you have wealth concentrated in the hands of the few it’s much more difficult to understand what’s going on using metrics that may have worked in the past.
This is why economic anecdotes aren’t very useful when trying to gauge the performance of the U.S. economy.
What happens if the wealth effect slows? The top 10% is spending more in part because their financial assets have increased in value substantially. Stocks are up. Housing prices are up. Equity in businesses is up.
The stock market is not the economy, but it seems like the two are now more intertwined than they were in the past.
I’m not sure what stops this. Wealth inequality is only getting worse in this country and frankly I’m not sure what stops this train. It feels like it’s unsustainable but the rich just keep getting richer.
Short of a financial crisis I don’t really see what slows this trend. Even then I’m not sure there would be much of a long-term impact. If there is a financial crisis, guess who has the means to ride out a storm and buy assets on the cheap? The top 10%.
Unfortunately, I don’t see wealth inequality getting better any time soon.
I’m fairly confident it’s only going to get worse from here.
Further Reading:
The Bottom 50%
This content, which contains security-related opinions and/or information, is provided for informational purposes only and should not be relied upon in any manner as professional advice, or an endorsement of any practices, products or services. There can be no guarantees or assurances that the views expressed here will be applicable for any particular facts or circumstances, and should not be relied upon in any manner. You should consult your own advisers as to legal, business, tax, and other related matters concerning any investment.
The commentary in this “post” (including any related blog, podcasts, videos, and social media) reflects the personal opinions, viewpoints, and analyses of the Ritholtz Wealth Management employees providing such comments, and should not be regarded the views of Ritholtz Wealth Management LLC. or its respective affiliates or as a description of advisory services provided by Ritholtz Wealth Management or performance returns of any Ritholtz Wealth Management Investments client.
References to any securities or digital assets, or performance data, are for illustrative purposes only and do not constitute an investment recommendation or offer to provide investment advisory services. Charts and graphs provided within are for informational purposes solely and should not be relied upon when making any investment decision. Past performance is not indicative of future results. The content speaks only as of the date indicated. Any projections, estimates, forecasts, targets, prospects, and/or opinions expressed in these materials are subject to change without notice and may differ or be contrary to opinions expressed by others.
The Compound Media, Inc., an affiliate of Ritholtz Wealth Management, receives payment from various entities for advertisements in affiliated podcasts, blogs and emails. Inclusion of such advertisements does not constitute or imply endorsement, sponsorship or recommendation thereof, or any affiliation therewith, by the Content Creator or by Ritholtz Wealth Management or any of its employees. Investments in securities involve the risk of loss. For additional advertisement disclaimers see here: https://www.ritholtzwealth.com/advertising-disclaimers
Please see disclosures here.